*Sensitive information has been removed or redacted in accordance with non-disclosure agreements.
Snapshot
About: Stakeholders requested a single data visualization. I uncovered the underlying need was a shared methodology for defining, valuing, tracking, and sharing innovation across regions to support leadership decision-making. This reframed the project into a global innovation management platform.
Role & scope: Research lead + data visualization designer. Owned discovery, problem framing, workshop facilitation, and usability testing; contributed to wireframes and interaction design.
Team: PM, 2 designers (incl. me), frontend engineering, backend engineering, data/analytics, business stakeholders.
Timeframe: 1 Year
Key Decisions (type / authority):
Problem definition + success criteria — Recommended (approved)
Research plan — Decided / Owned
Standard of evidence (“decision-grade”) — Decided / Owned
Information architecture — Decided / Owned (within approved direction)
Interaction design — Decided / Owned (within approved direction)
Concept / direction to advance — Recommended (approved)
Problem
Brief I received: The request was to deliver an interactive bubble scatterplot. After stakeholder interviews, we uncovered the real need wasn’t a single visualization—it was a shared way to define, value, and track innovation initiatives consistently across regions to support leadership decision-making.
Reframed problem: Leadership needed to understand how innovation contributed to topline growth and track progress against the company’s five-year strategic plan to drive better prioritization and investment decisions.
Research
Methods:
Stakeholder interviews: (n=3) Helps to ground the project in business goals, and becomes the basis for my entire reframing approach. The reframe lands more credibly when it achieves the desired business outcome than just delivering what the business asks for. This also serves as the framing of the discovery space I explore with users. I interviewed the leaders in marketing, technology, and innovation to understand rationale behind the project.
User Interviews & Observation: (n=20) This is where I use the business goal uncovered in the stakeholder interviews and try to understand how the innovation teams work in achieving those goals. I choose behavioral observation so all later attitudinal elaborations are grounded in how the team is actually working.
Thematic Analysis: I used miro to cluster behaviors and quotes to find the emergent themes. I opted for inductive coding because I preferred to have the latent structure emerge from the data rather than imposing it.
Learnings
Portfolio tracking was decentralized: Teams lacked a shared view of the innovation pipeline, making it hard to track progress and make timely resourcing, budget, and prioritization decisions centrally.
Data wasn’t structured for actionable insights: Without a useful information architecture, teams couldn’t explore the portfolio across multiple levels of granularity or slice across key decision dimensions.
No explicit innovation decision flow: Teams needed a repeatable workflow for evaluation, prioritization, progress monitoring, and course correction. Retrospective analysis was often skipped, so teams couldn’t reliably improve forecasting.
Silos, duplicative efforts, and slow collaboration: Divisions worked on similar efforts unknowingly. Finding project owners and sharing work was difficult, increasing duplicated time and spend.
Artifacts: Experience map, personas
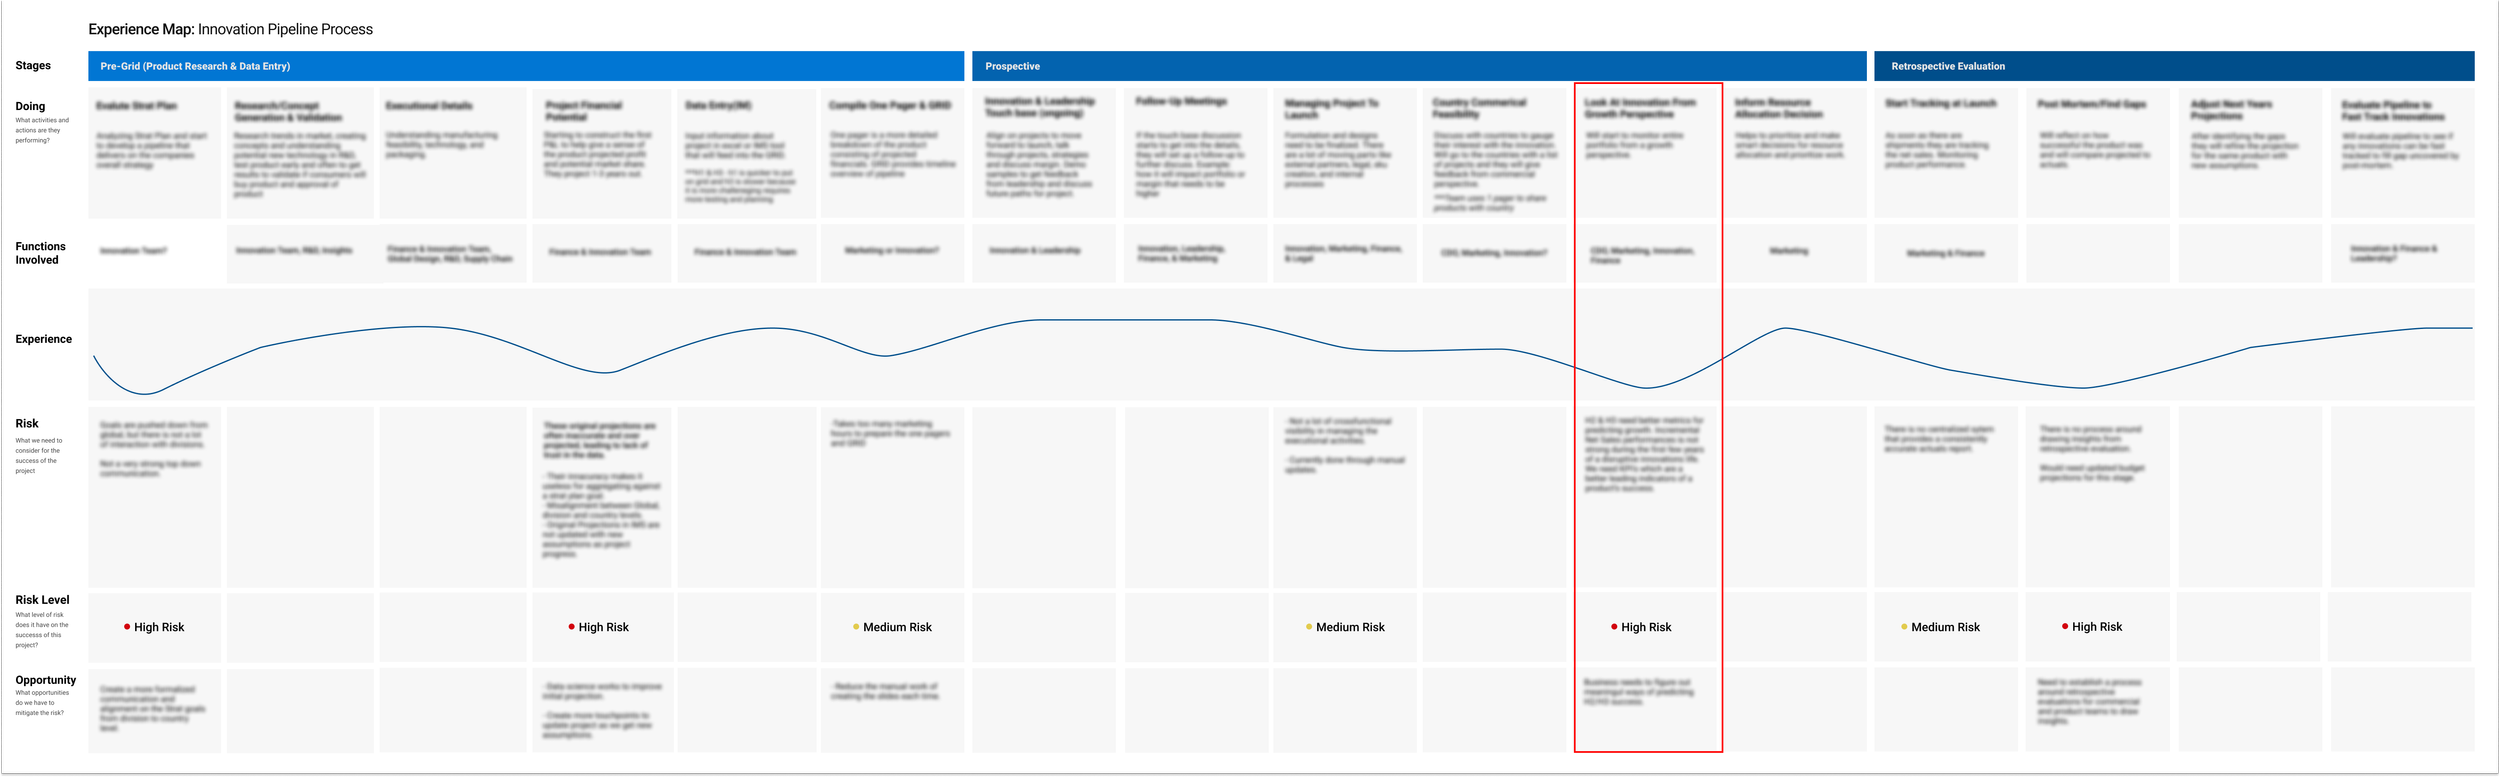
Experience map showing the original ask (red) vs the end-to-end process we ended up scoping for.
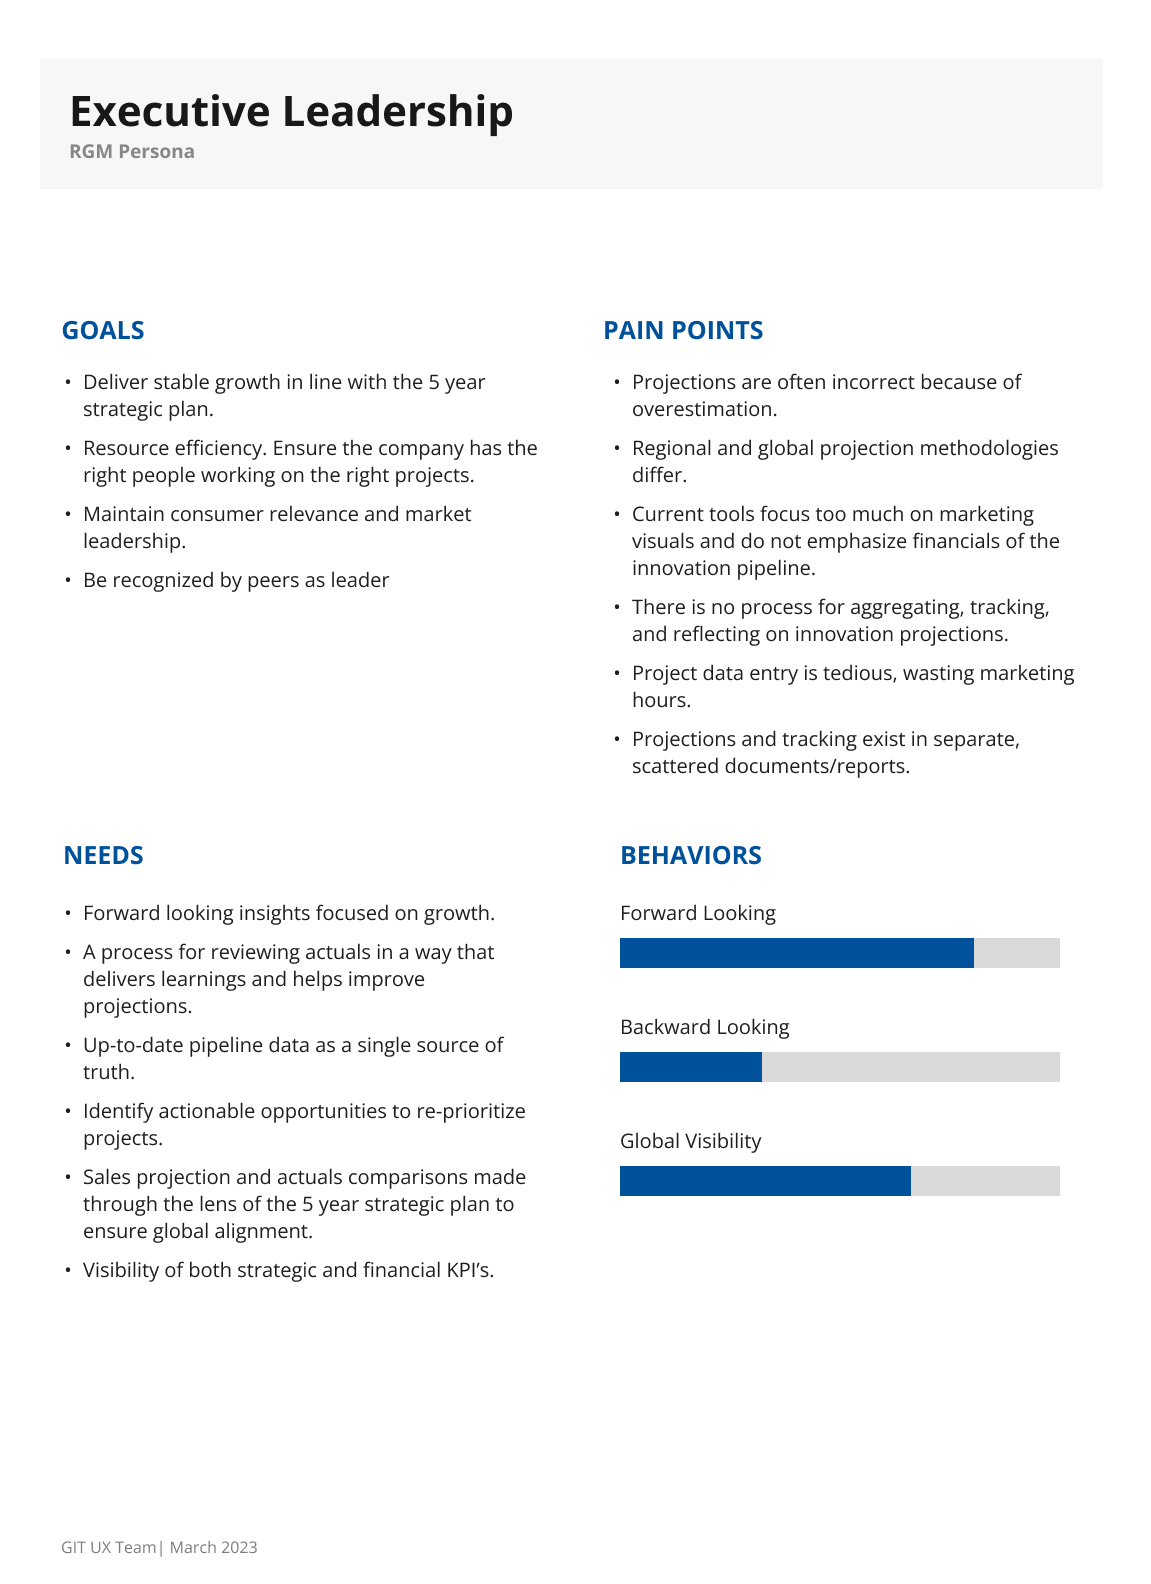
One of the personas.
Options and Tradeoffs
Speed to Deliver vs Completeness/Scalability
Single chart: Fastest, but with limited decision support and weak scalability.
Analytical dashboard: Stronger portfolio visibility, primarily supports leadership.
Innovation Workspace and Process: Highest effort, but most complete solution. Tracking, governance, collaboration, long-term scalability, and support for all innovation roles.
Speed to Value vs fit to workflow
Build: More time and effort, but fully customized.
Buy: Faster, but limited customization.
Decision
The company’s growth targets demanded a more rigorous innovation process and a holistic solution that would scale and serve us in the long term. Stakeholders were interested in full customization so that the team could better define workflows. We built a custom innovation workspace and end-to-end innovation tracking process (discovery through retrospective).
Design
Methods:
Design Workshop: With a 2-person design team, the solution space was too large to generate sufficient divergent directions internally. I planned and facilitated 2 design workshops with designers across several product teams. Participants were selected based on their proficiency in domains relevant to our project. The workshop included ice breakers to get participants comfortable with exploratory sketching, crazy 8’s to generate and explore design directions, group sharing and discussion, closing out with effort/impact matrix for prioritization.
Usability testing: (n= 24, 6 iterations) We opted for task-based usability testing with think aloud because we were designing a new workflow, which required a deeper understanding how it fit users’ mental models. Tasks were made to reflect real world scenarios users would encounter while on the job, and were then handed the prototype to see if they could resolve the problem. The tasks were structured to test discoverability, findability, and usability. Insights were clustered to reveal deeper problems in the workflow. The issues found were prioritized according to user impact, and product team effort.
Objectives
Support innovation management from inception through in-market performance, so teams could forecast, track topline performance, evaluate initiatives, diagnose gaps, and prioritize key projects.
Create a standardized decision methodology for evaluating innovations across the product lifecycle: financial projection, production approval, launch, and retrospective evaluation.
Increase project visibility across the organization so teams could leverage ideas, insights, and existing work from other regions to inform their own initiatives.
Challenges
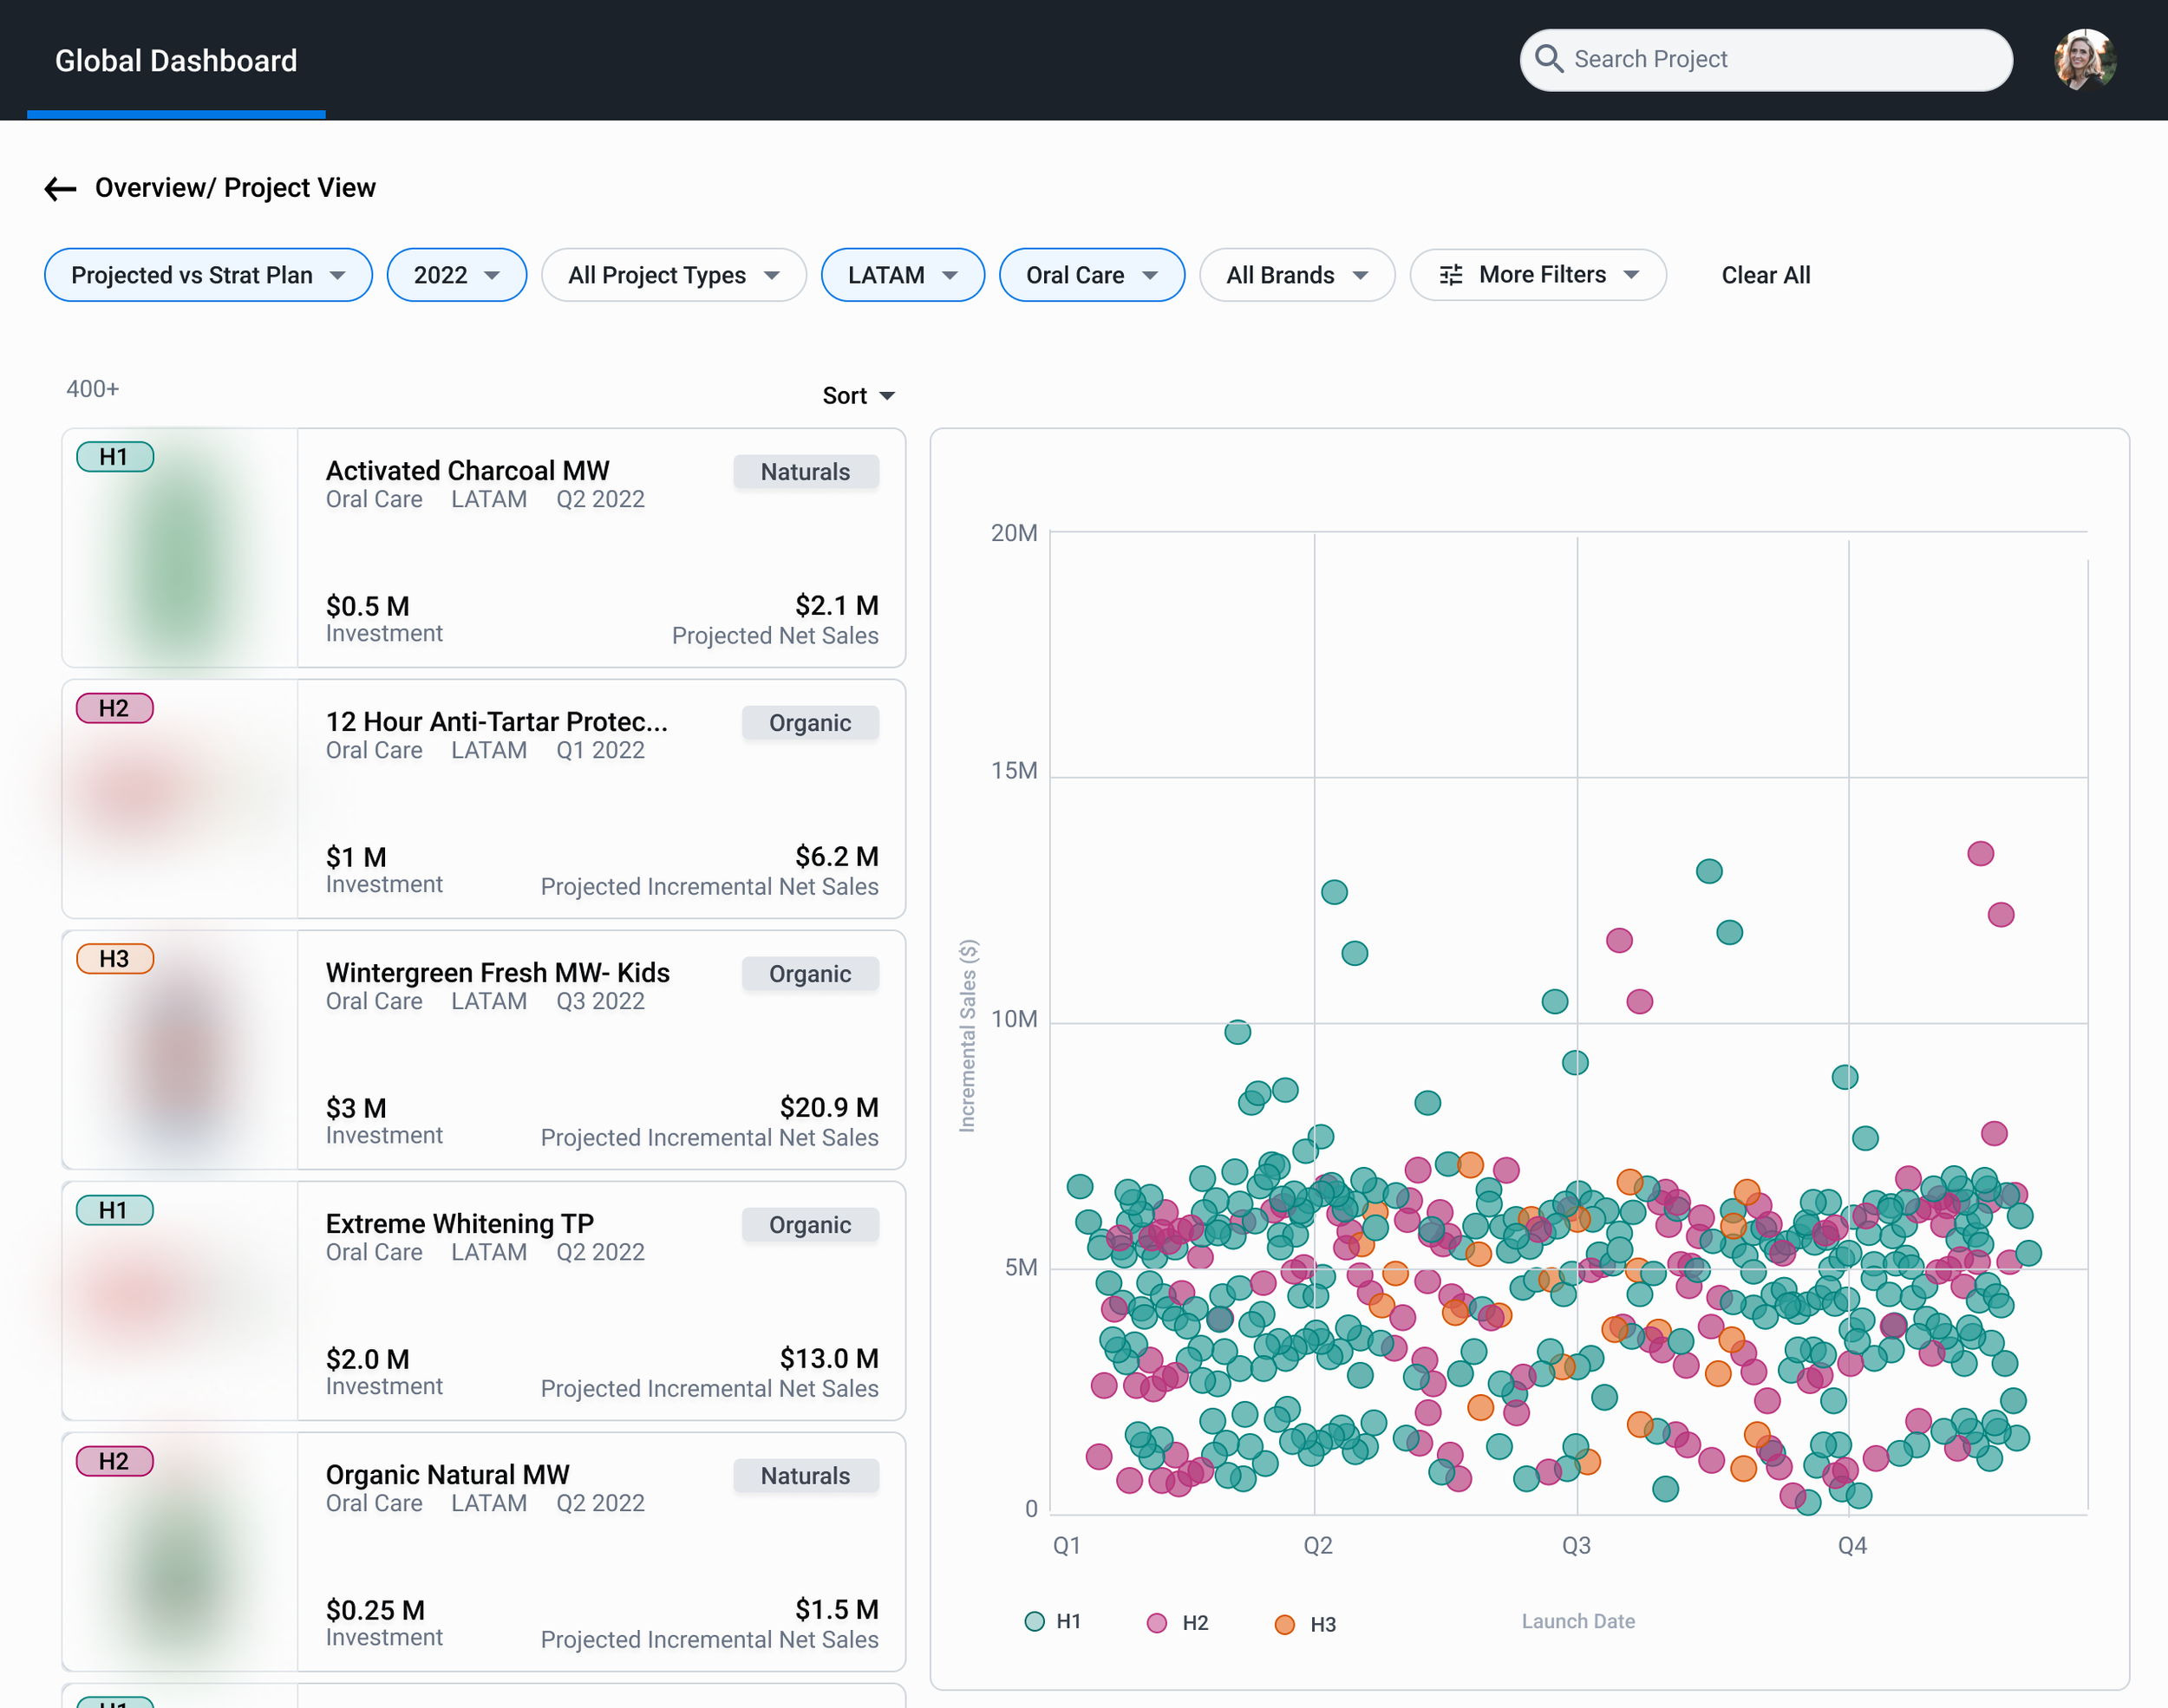
Innovation goals were distributed across overlapping business dimensions. Users needed to understand topline performance as well as how specific regions, innovation types, product categories, and time periods interacted. Additionally, all of these dimensions existed at different granularities, so the experience had to support drill-down without feeling too fragmented. We created linked charts that cross-filtered, so context was preserved as users drilled down.
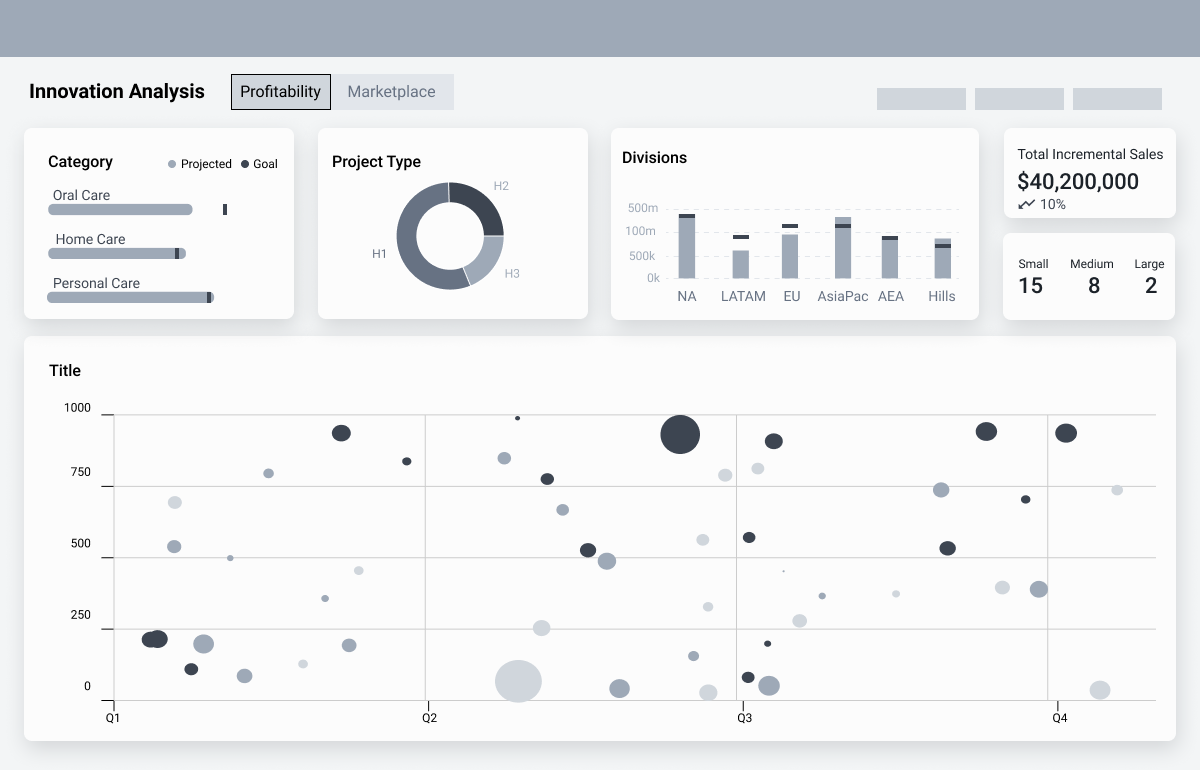
Users were reading these as unrelated charts
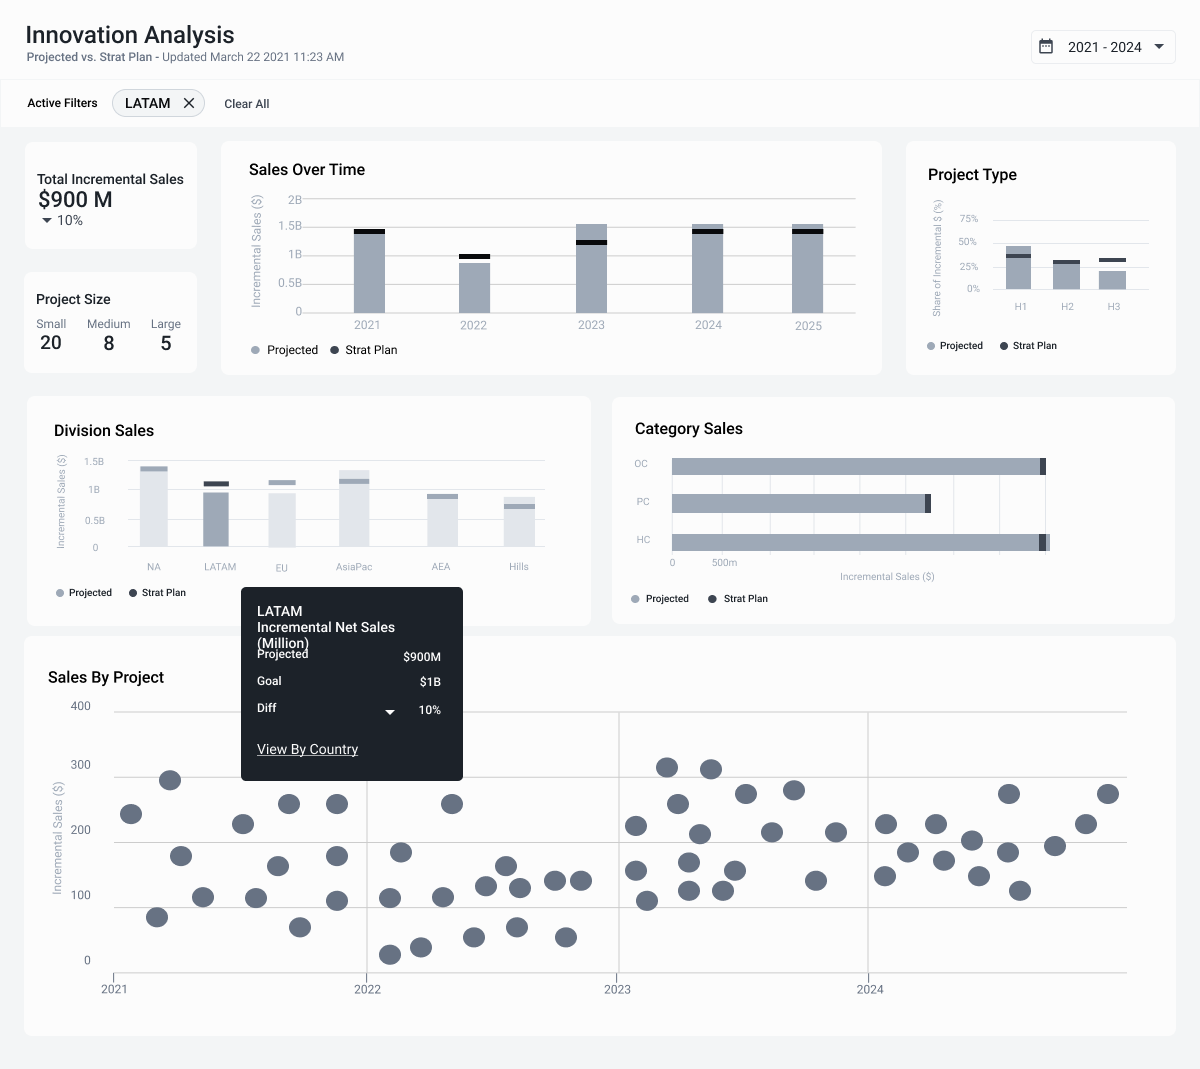
In testing, we found a clear filter bar was key in understanding relationships between charts.
Teams evaluated their projects differently across levels and geographies. A major challenge was getting a project-level view that would satisfy executive leadership's need for consistency while still supporting regional decision making. If the data entry became too cumbersome trying to accommodate everybody’s unique process, then adoption would suffer. Discovery gave us a general sense of overlap, but iterative testing helped us converge on how projects should be represented.
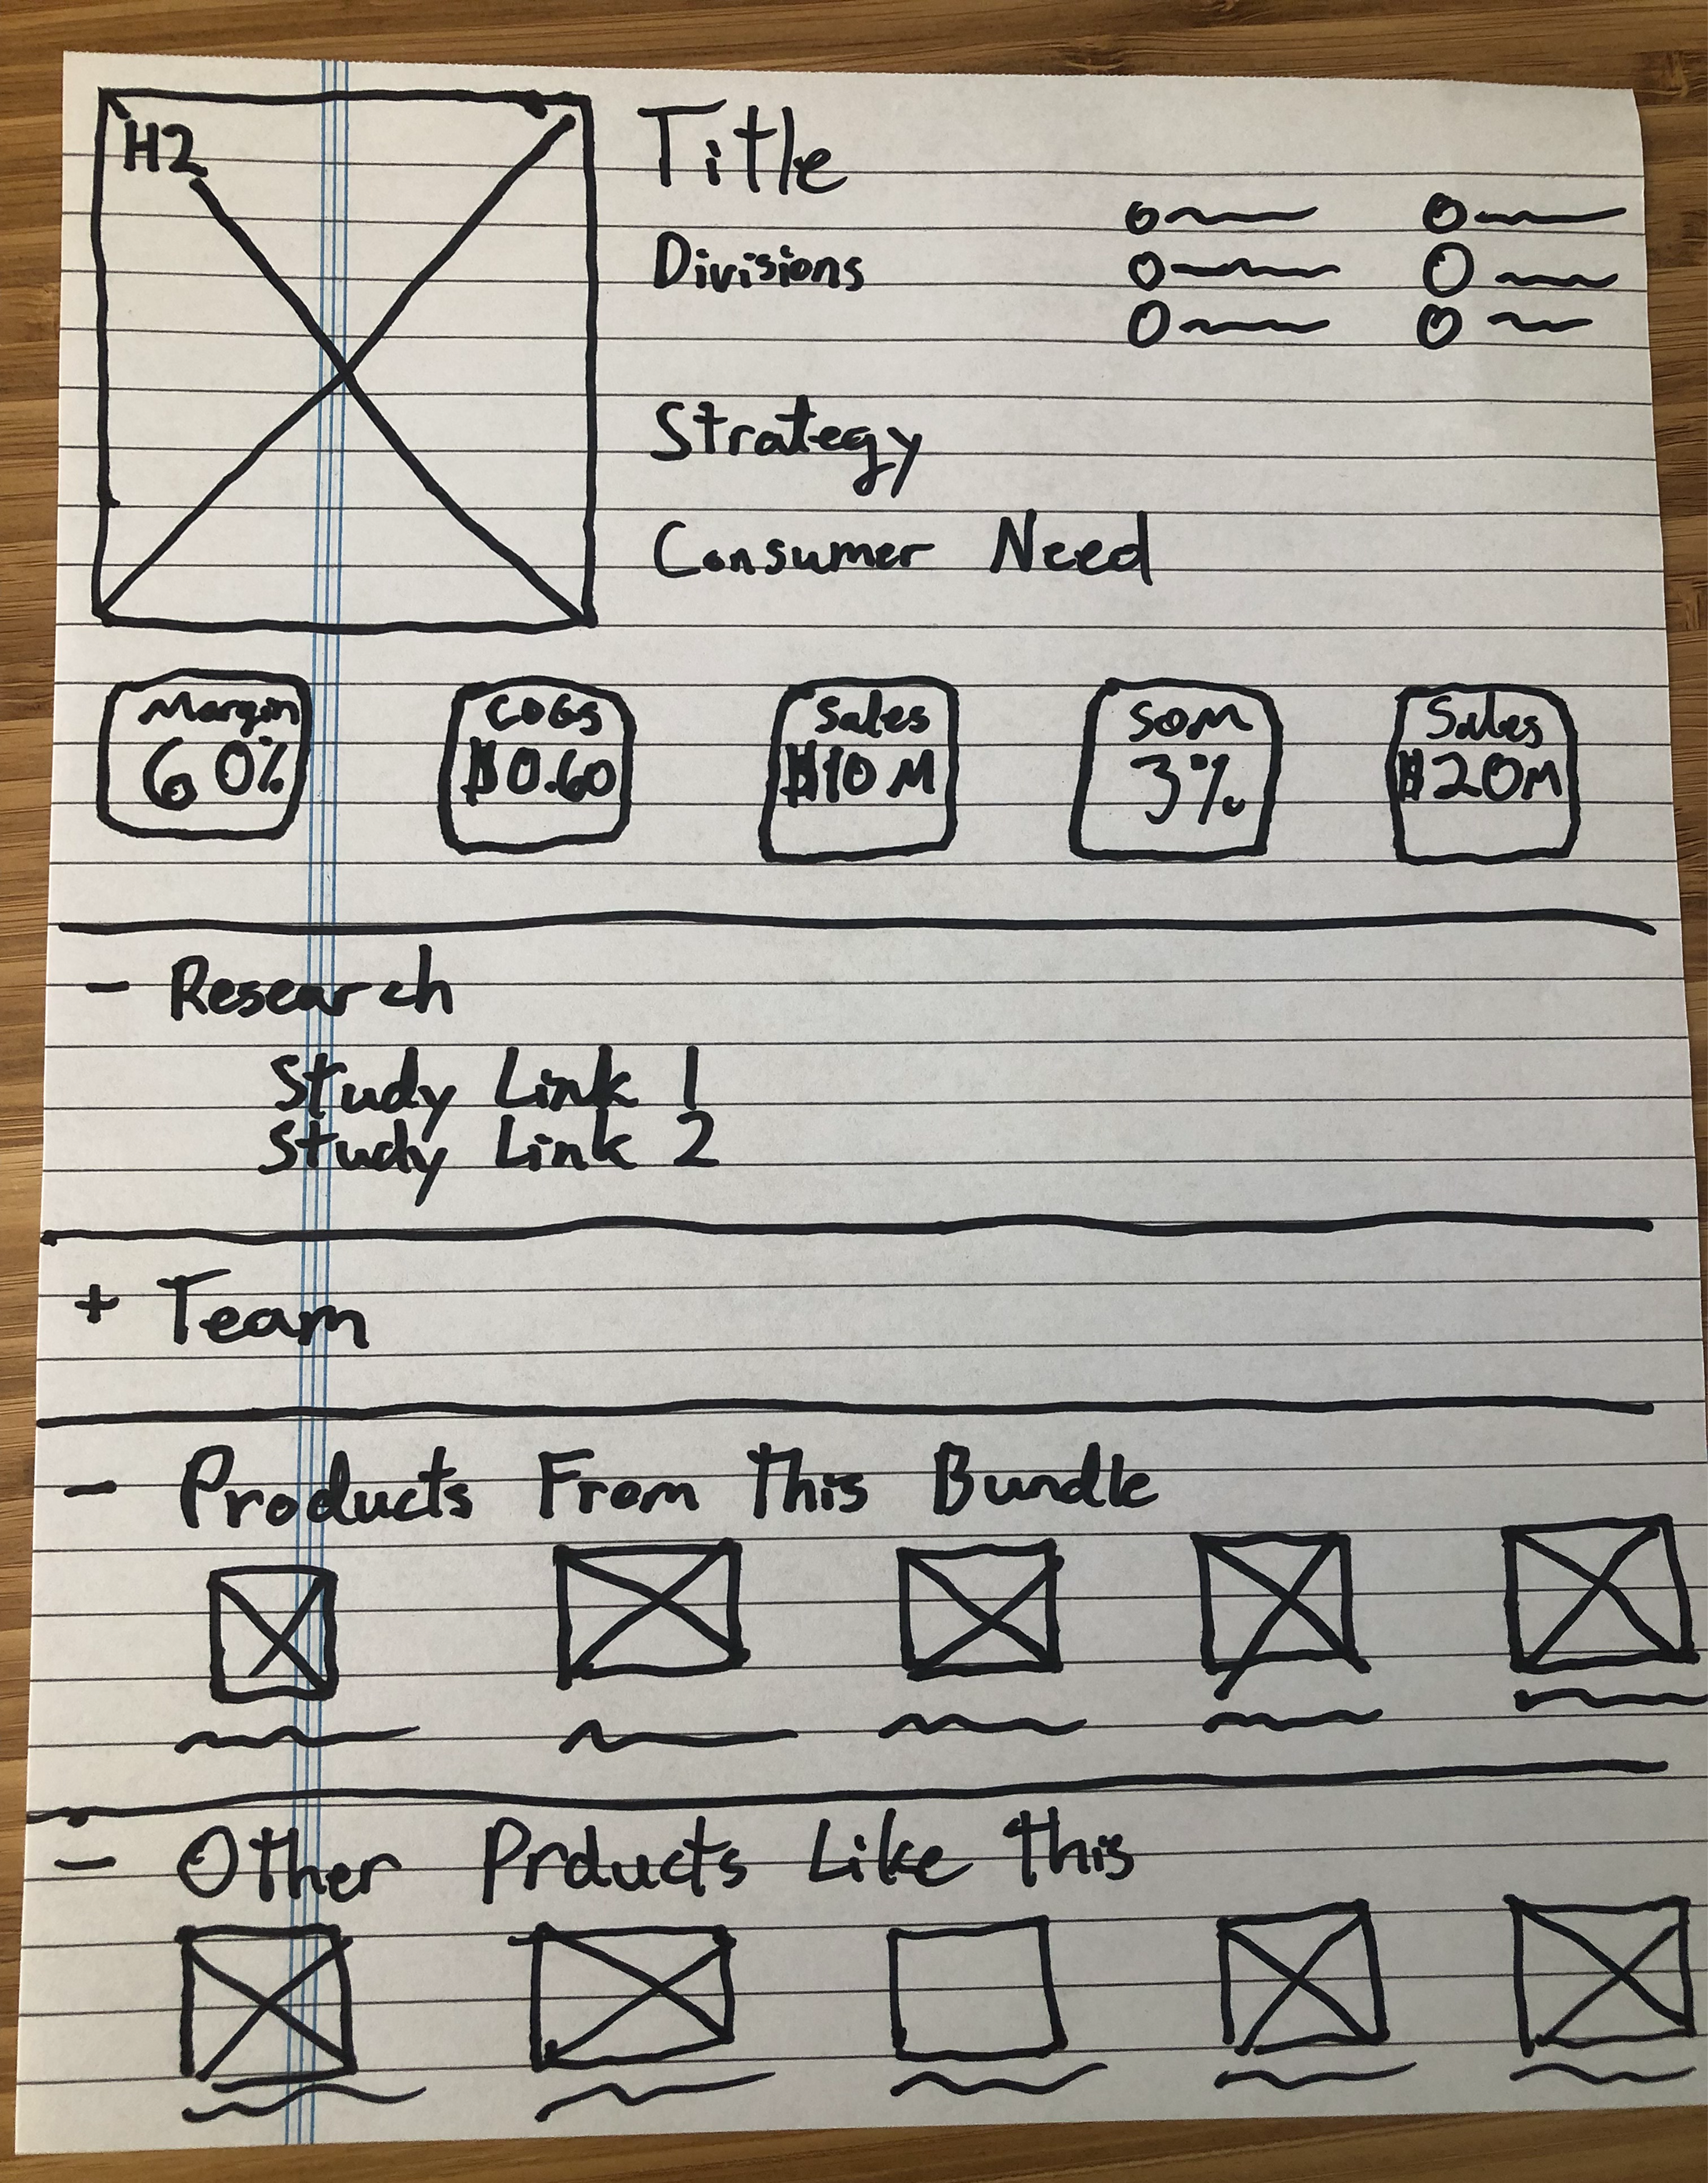
Trying to identify the “must have” information driving decisions.
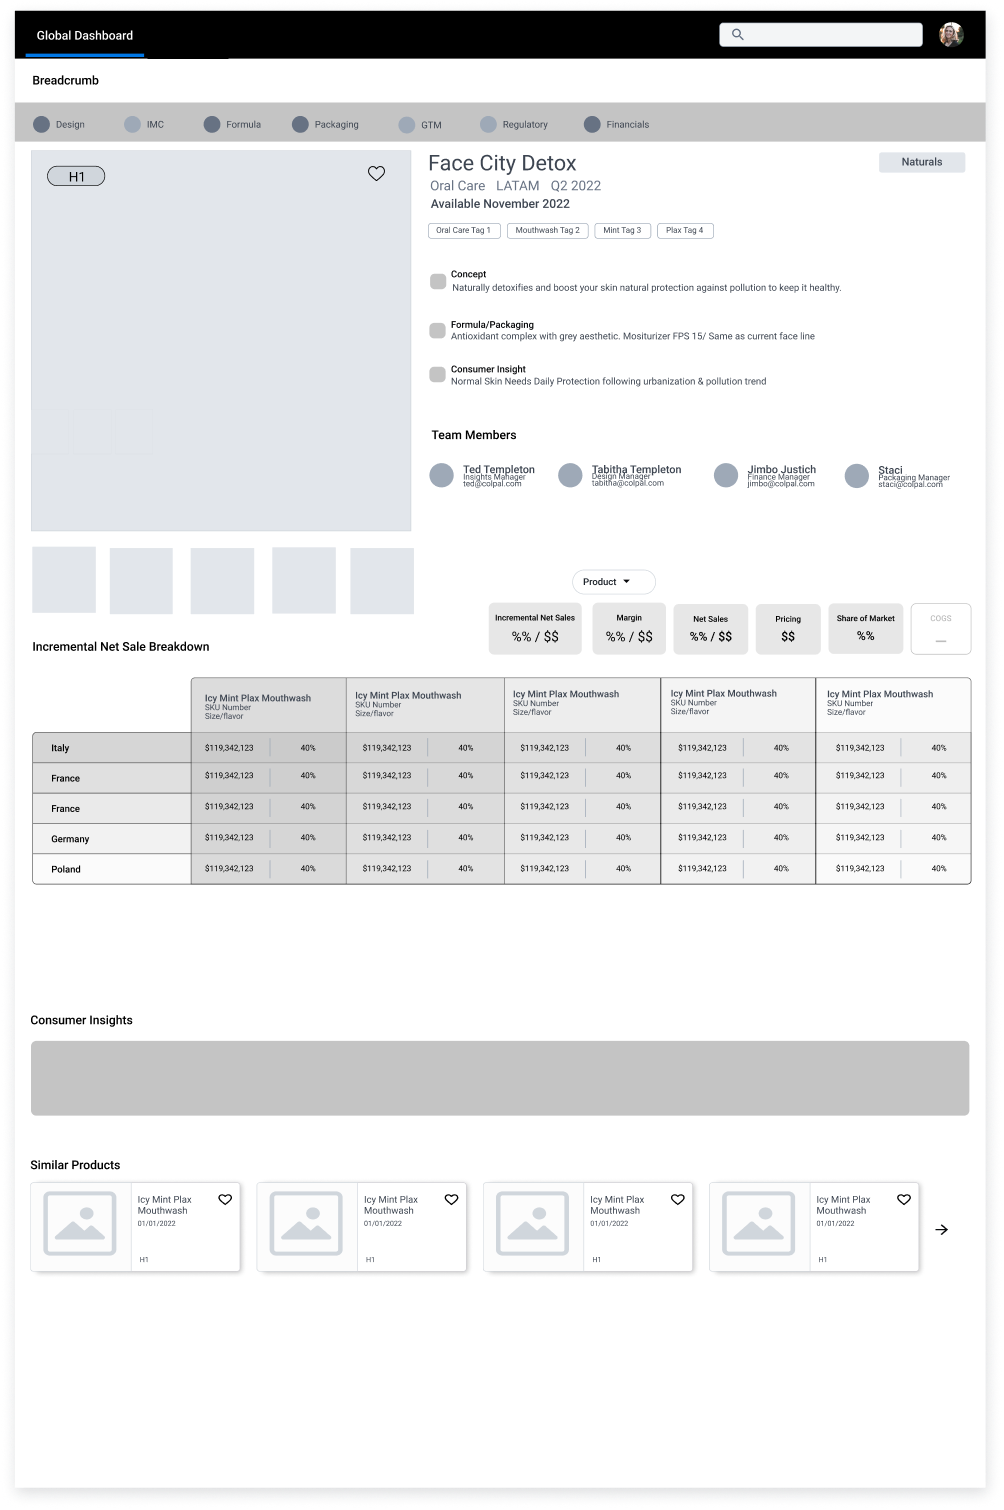
We tested different granularities of information until we found the correct level.
Teams “shopped” for innovations they could adapt from one region to another. They looked for different projects based on specific business needs and market conditions. So the browsing architecture needed to reflect how the business planned to use the innovation.
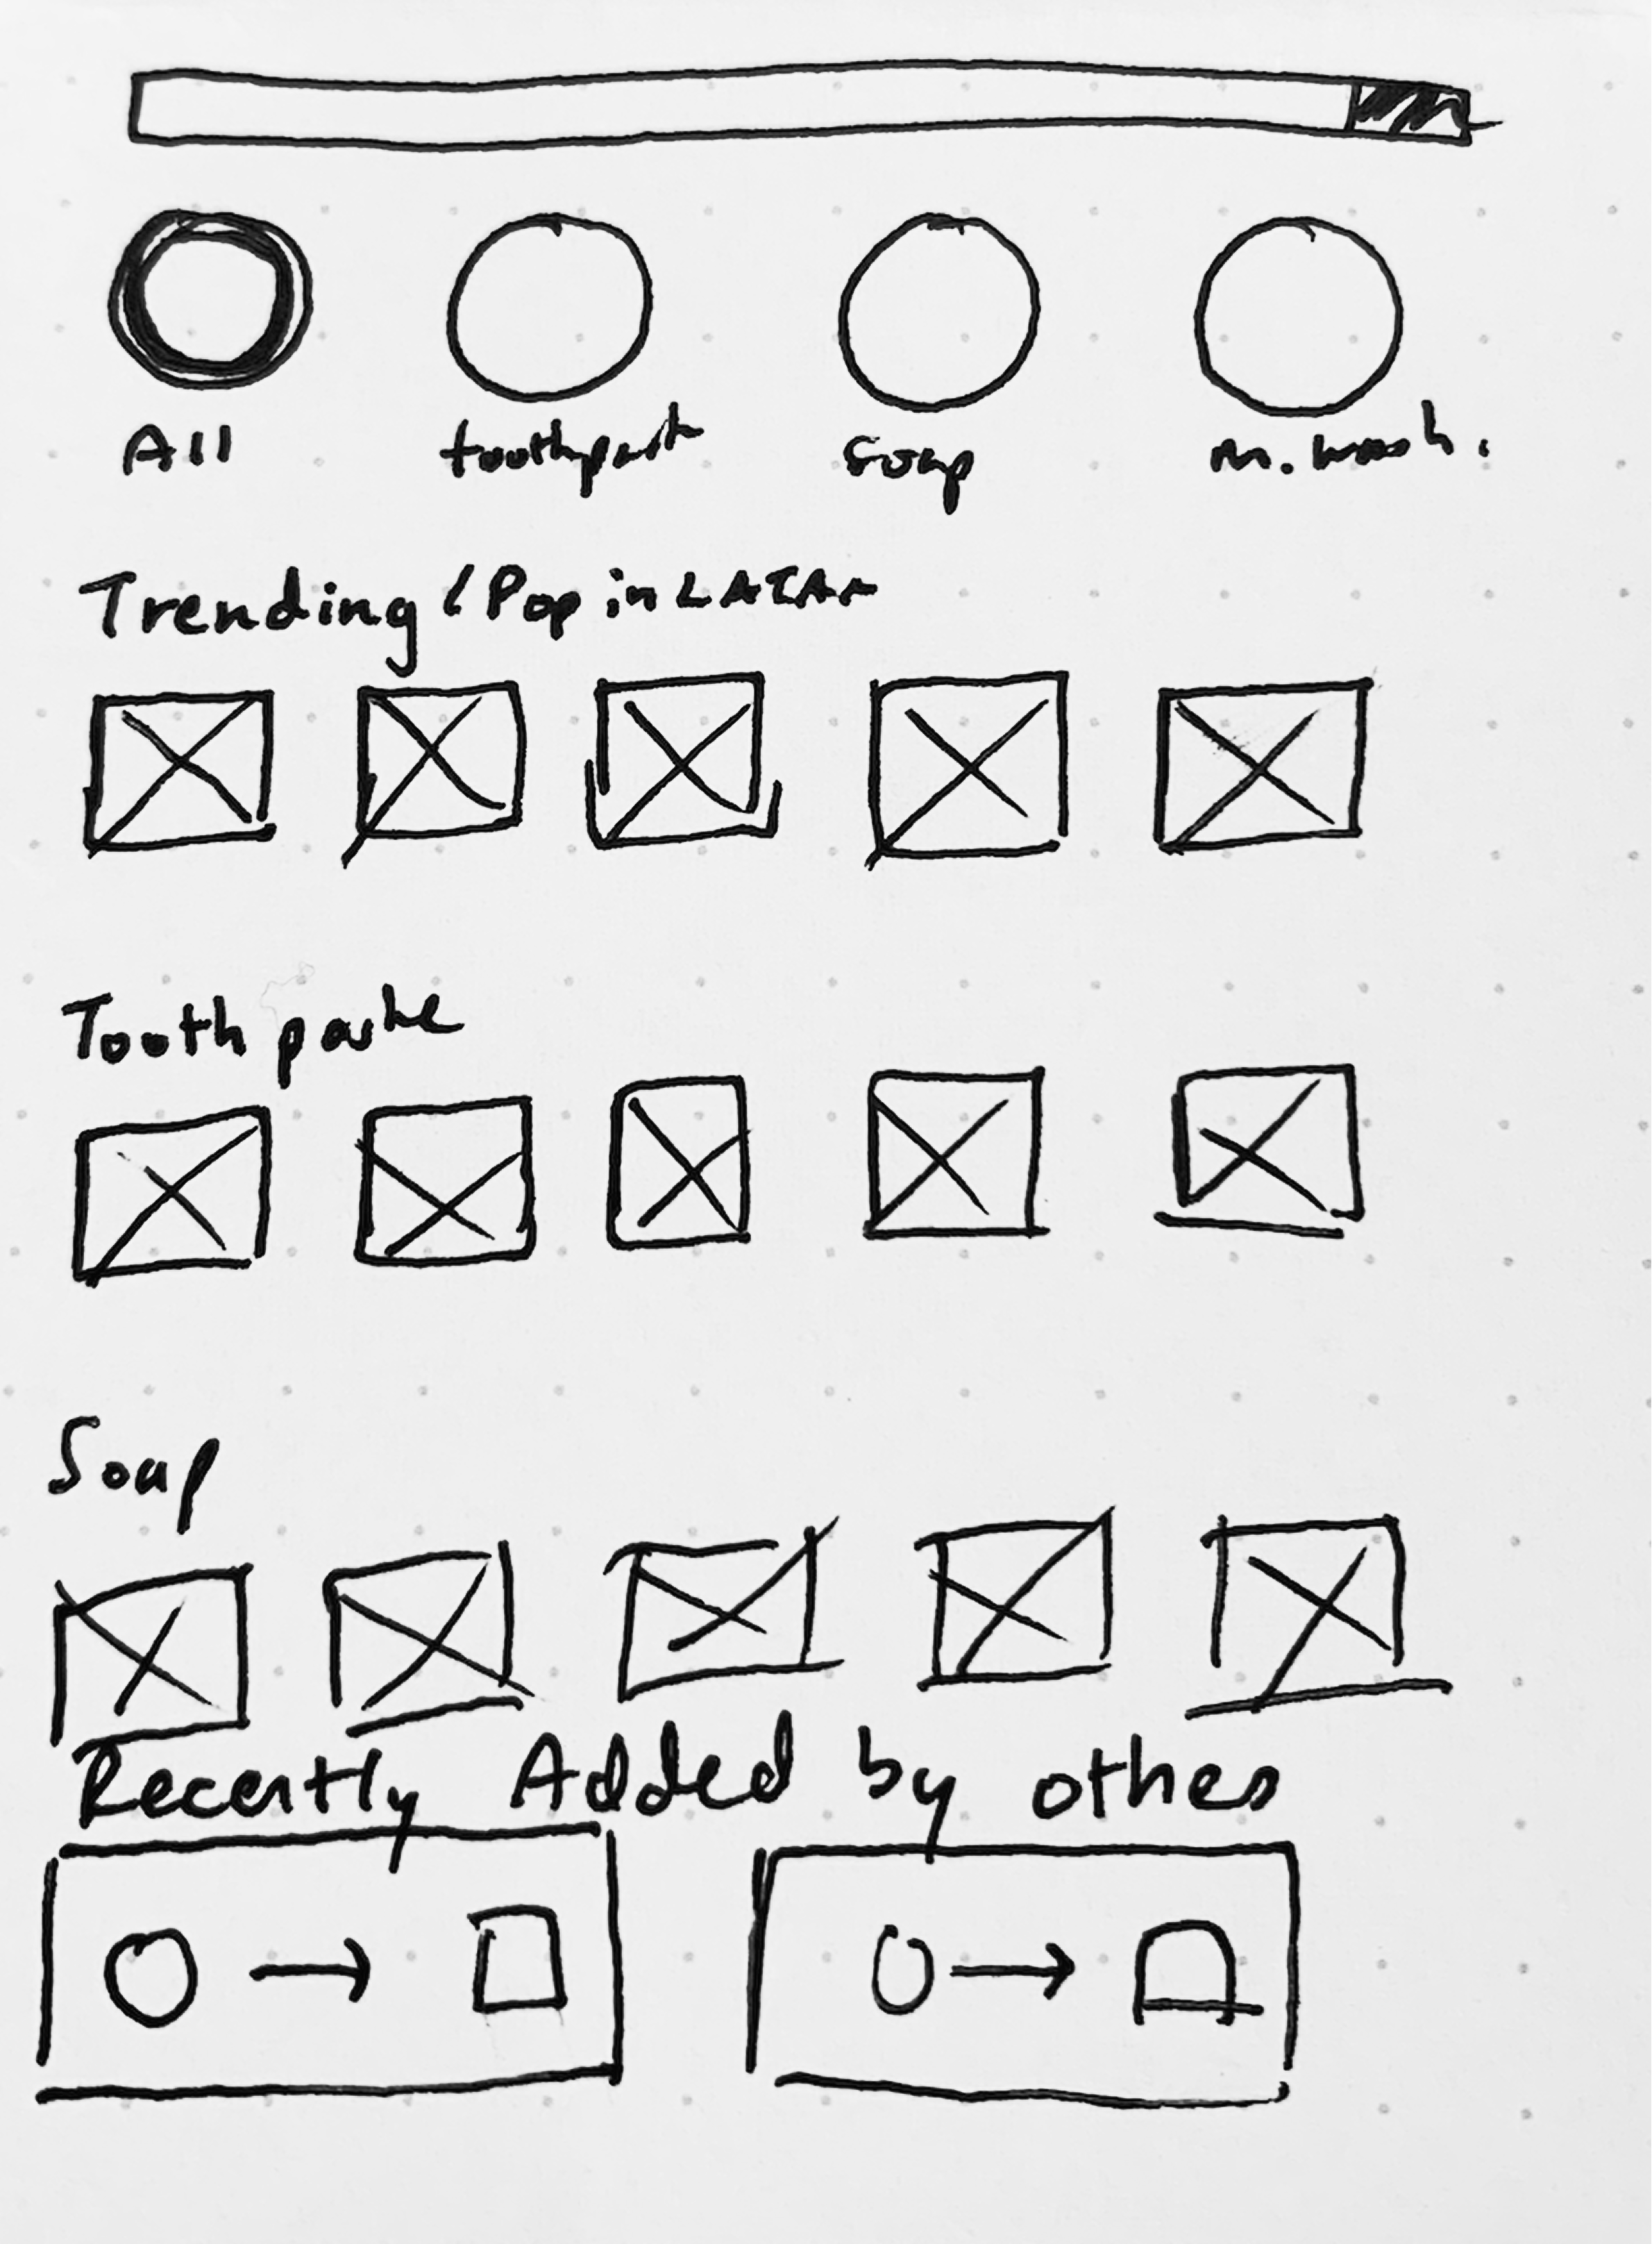
Initial sketch.

The key to getting this right was finding the right categories for efficient discovery.
High Fidelity

Topline portfolio view
Drill into specific projects
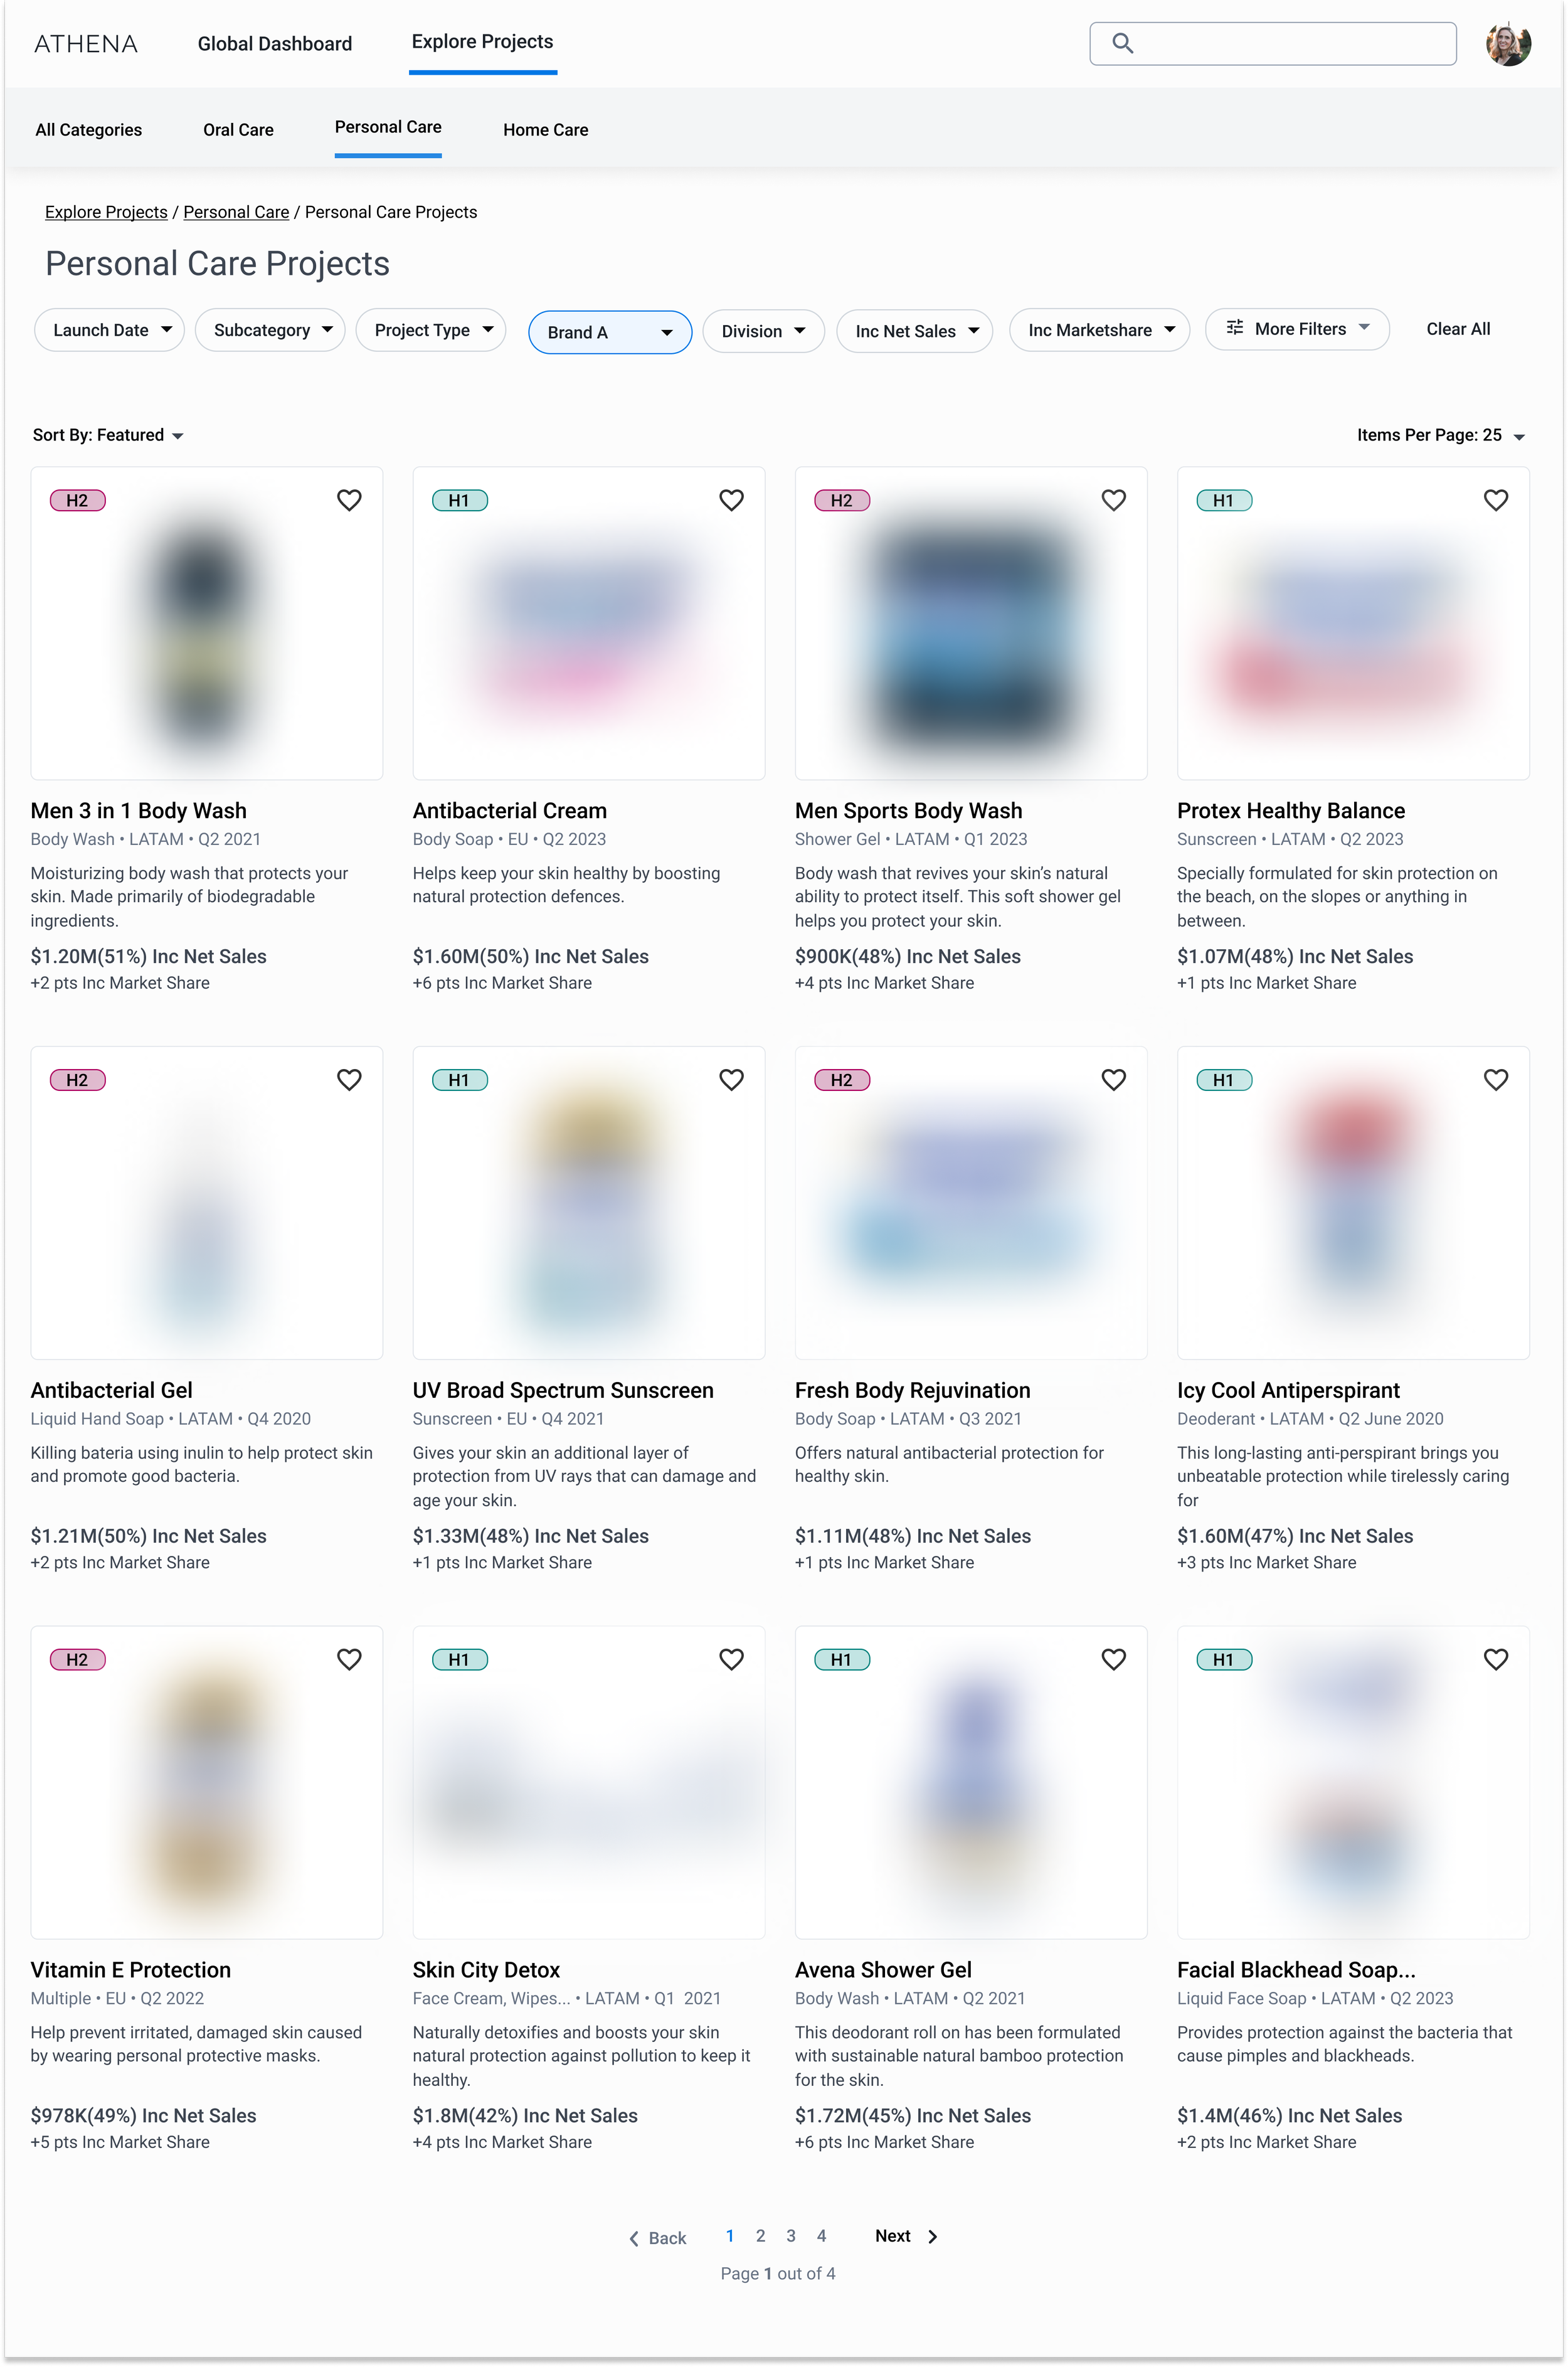
Browse projects by business need
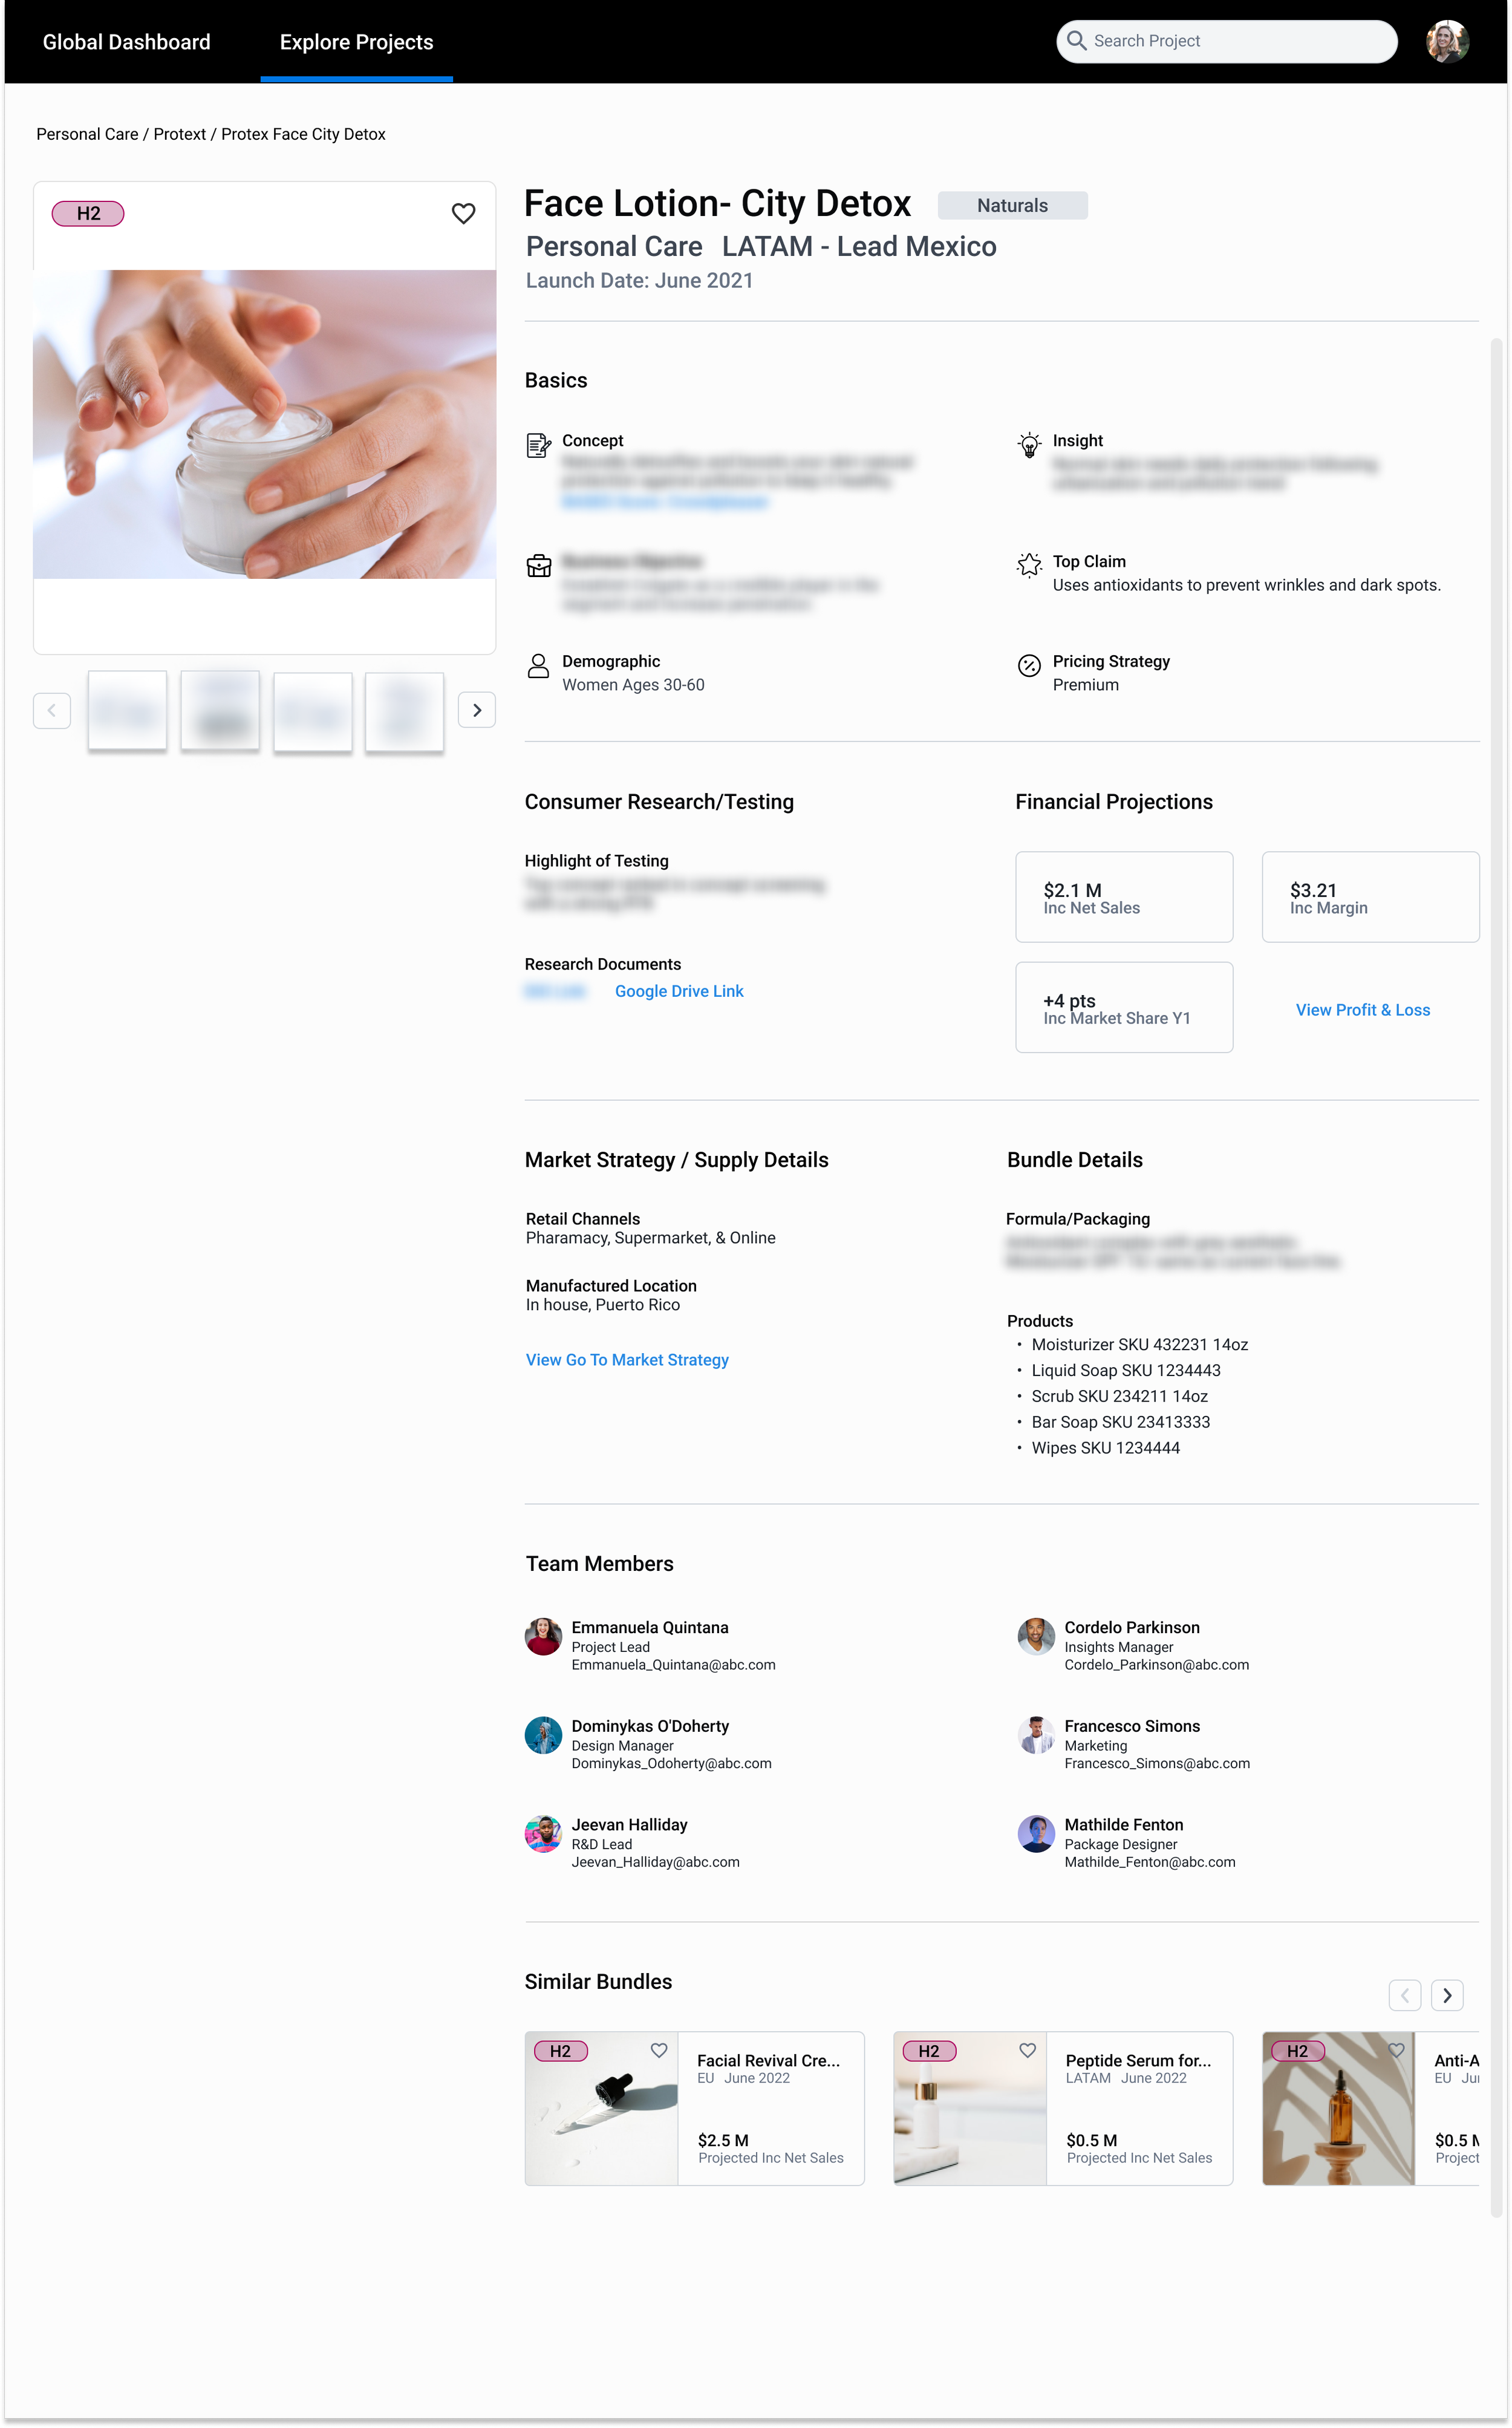
Individual project level
Impact
Adopted across 31 of 32 brands in the portfolio.
Used by 1,523 total users,including 300 monthly active users
Supported management of 1,859 projects
Provided portfolio visibility into $4B in incremental net sales