*Sensitive information has been removed or redacted in accordance with non-disclosure agreements.
Snapshot
About: Stakeholders asked for advanced reporting for the analytics team. Through research, I uncovered that business users lacked the ability to convert data into insights and commercial plans they could sell to their customers. This reframed the tool into diagnostic analytics and scenario planning that reduced dependence on the analytics team.
Role & scope: Design lead + research lead; data visualization lead. Owned discovery, problem framing, design workshop facilitation, and usability testing.
Team: 5 UX (including me), PM, Front end, backend, data foundation, modeling, & business stakeholders.
Timeframe: 2 Years
Key Decisions (type / authority):
Scope- Recommended & Facilitated alignment
Research plan- Decided
Standard of evidence- Decided
Information Architecture- Decided
Design System- Decided
Final Design Direction- Decided
Problem
Brief I received: The initial request was to create reports for the analytics team, so they could better support sales planning. After discovery, I found the problem was deeper than report access. Data was fragmented across silos, teams spent a lot of time wrangling it, and insights were difficult to translate into actionable sales plans.
Reframed problem: Sales planning was mostly driven by individual past experience, which kept teams locked into familiar patterns and chasing incremental wins. As company growth goals demanded new ways to outpace the market, the planning process did not give teams a consistent way to turn data into shared decisions that they could sell to a retailer.
Research
Methods:
Stakeholder interviews: (n=4) I interviewed leaders in customer development, marketing, IT, and analytics. While the stakeholders typically make the product request sound decided and straightforward, this is where I am able to understand the political assumptions, institutional history, and business need that led to their working hypothesis. Understanding the desired business outcomes allowed me to look past the surface level request to understand the underlying need, helping me to better frame my research with users.
User interviews and observation: (n=24) Because a large portion of the problem was a gap between current and desired user behavior, this required precise triangulation of attitudinal and behavioral data. The gaps between their actions and beliefs helped us form a working model of what level of behavior change might be possible.
Qualitative analysis: We opted for inductive thematic analysis, preferring a more interpretive lens. So much of the current process was tied up in institutional habit and established process, we needed to reveal the latent structure of the process, to make it easier to map to business’ desired goals.
Learnings
Turning data insights to selling stories: Sales teams wanted to be seen as retail business partners, rather than just suppliers. This required effective storytelling to help retailers better understand their own shelf experience. Forming this story from data was a major challenge.
Understanding commercial plan impact: A lot of planning was done from habit, often relying on instinct more than data. Evaluating last year’s performance, this year’s progress, and next quarter’s forecast was not a standardized methodology.
Excessive data wrangling: Teams were spending a lot of time cleaning and organizing data to create reports. This is time that could be better spent analyzing, planning, or talking to retailers.
Data Silos: Teams were looking at different reports, with different data, speaking different languages (figuratively). Data needed to be centralized so that everybody had the same source of truth. Reports needed to be democratized so that all roles were able to extract insights.
Experimentation: Teams became tired of trying to stack small, short term wins to keep up with the market. They wanted plans that generate long-term, sustainable growth. It was important to give teams a way to experiment, challenge assumptions, and re-think their typical approaches.
Artifacts: Interaction blueprint and personas.
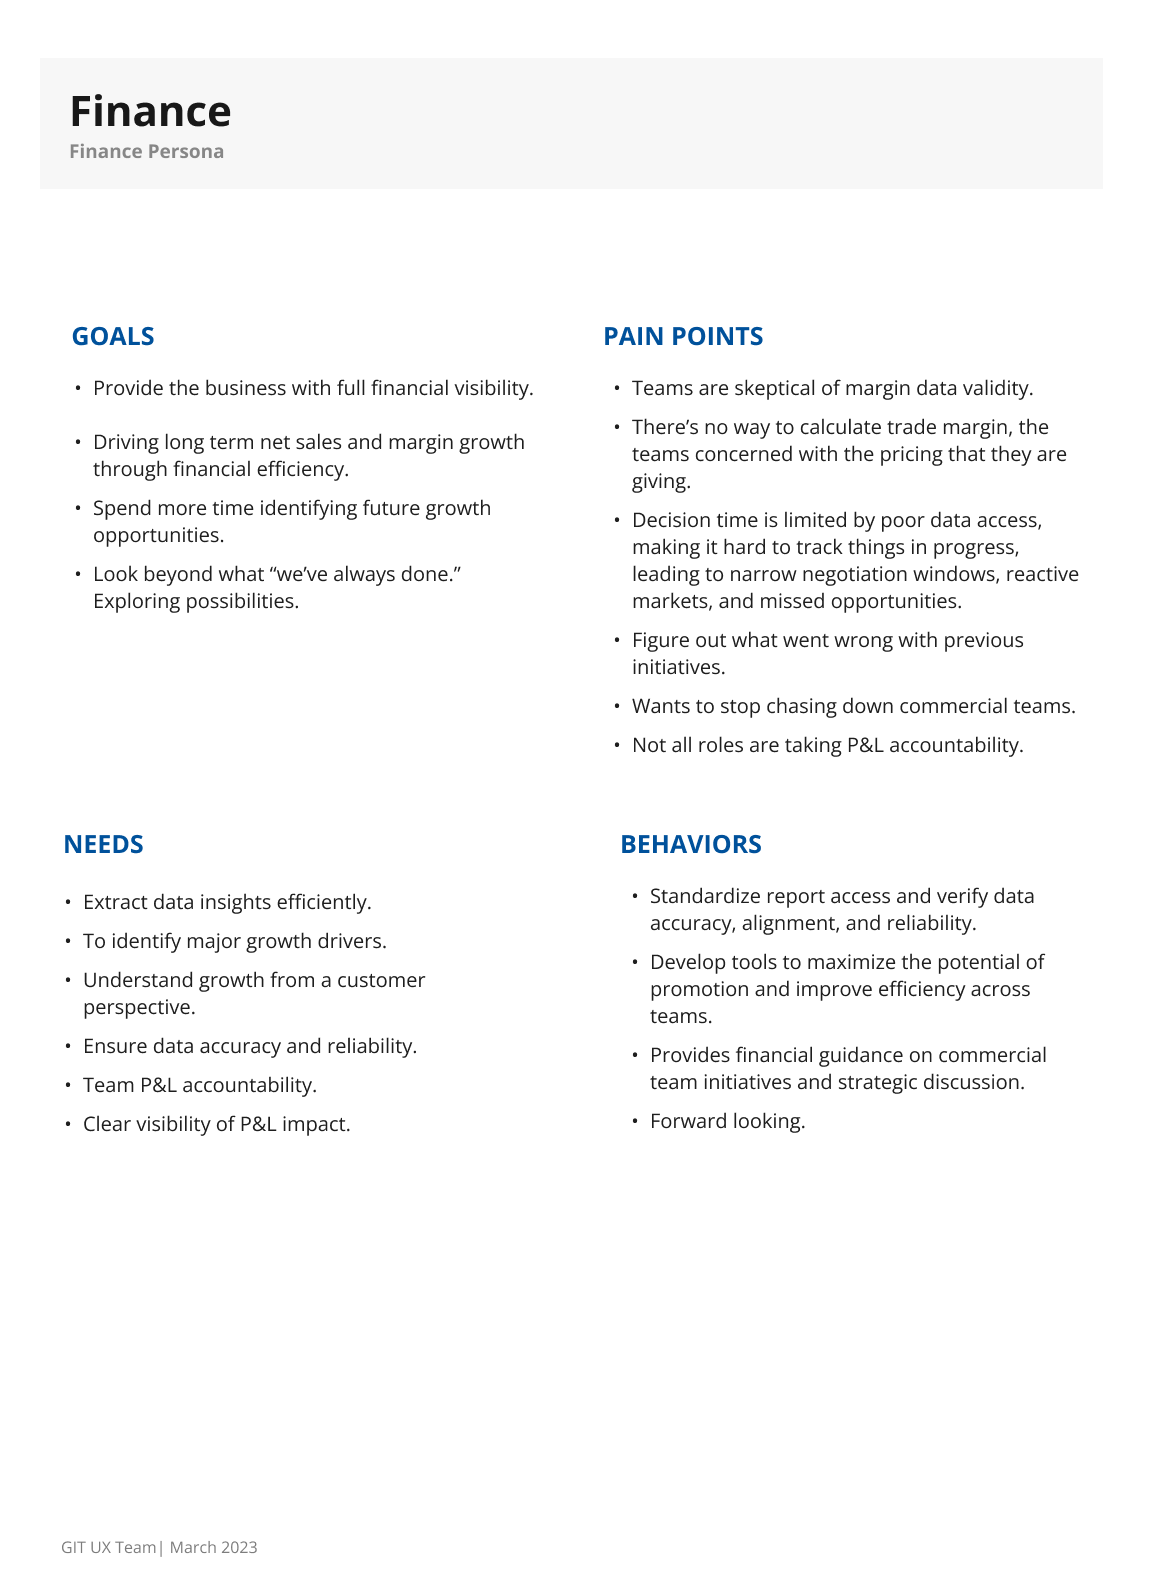
Persona for Finance role
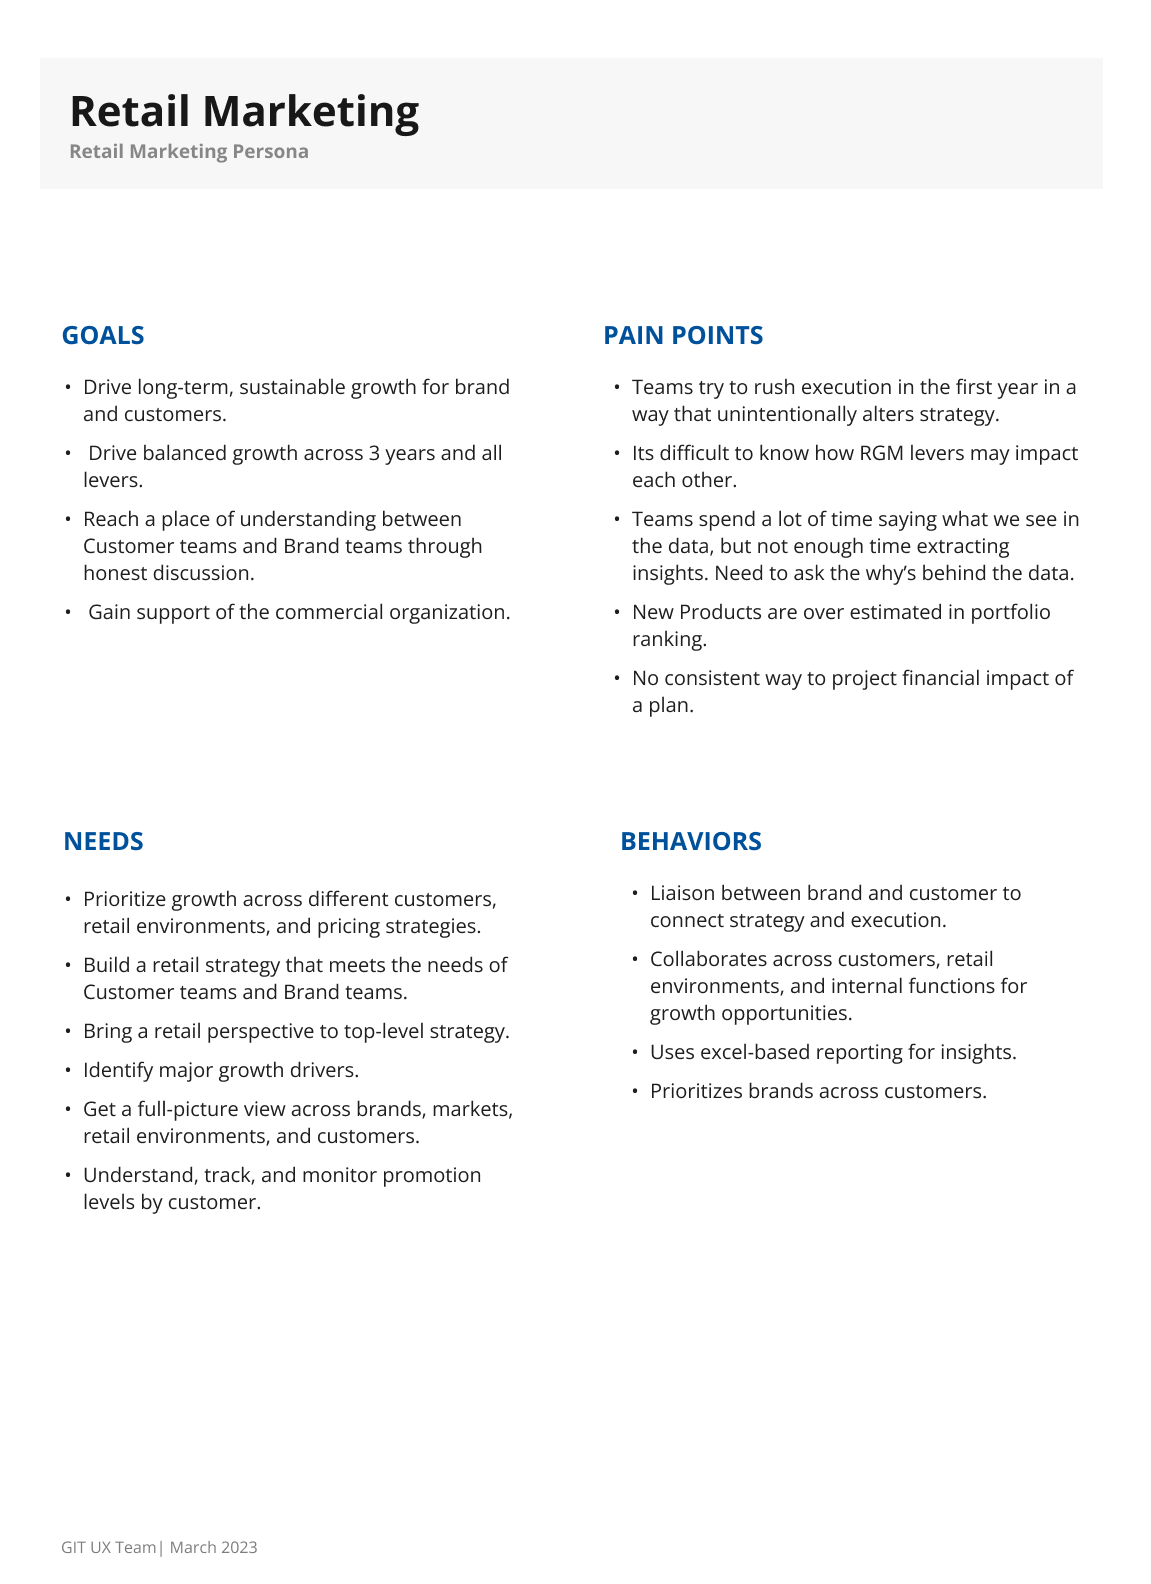
Persona for Retail Marketing role
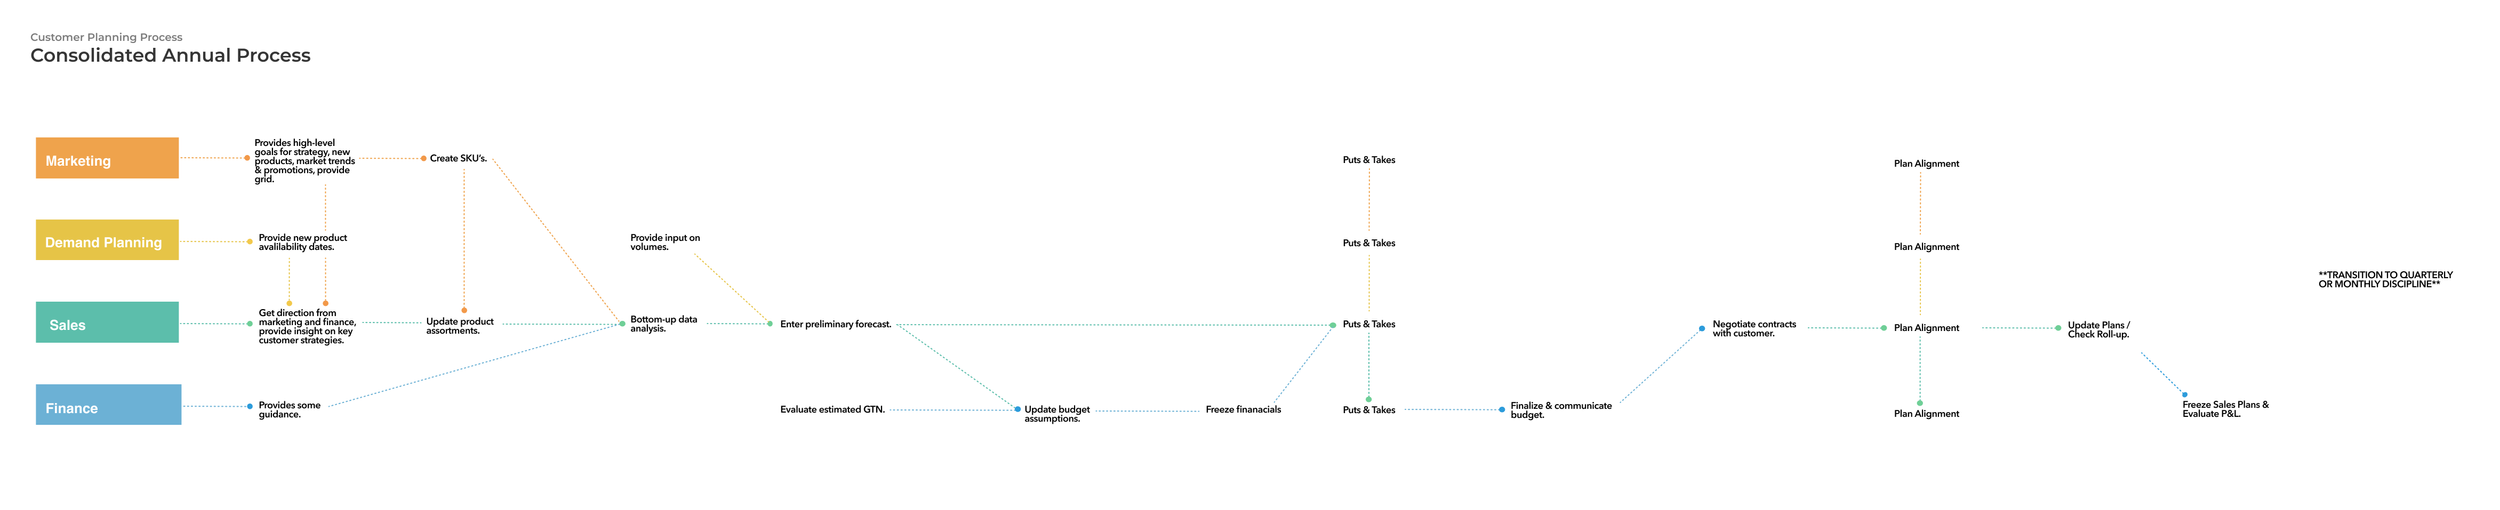
Annual planning process depicting how all the key roles align on plans for the year.
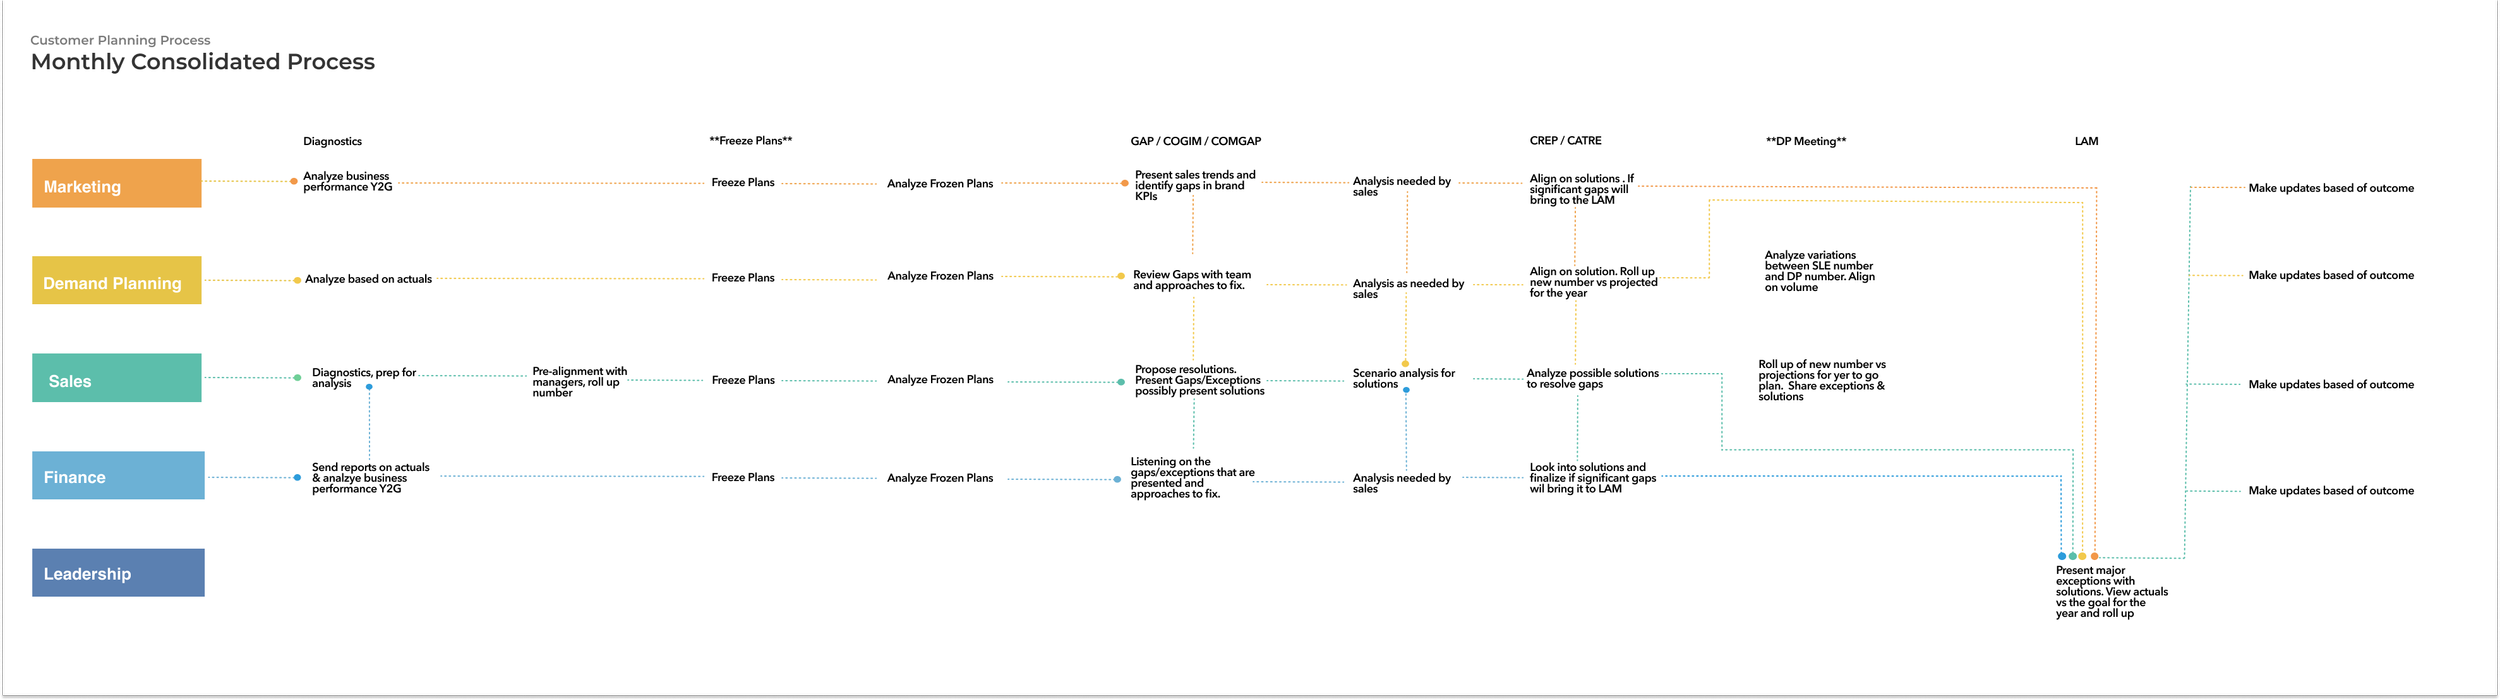
Monthly planning process showing how plans are refined iteratively throughout the year
Options and Tradeoffs
Since project kickoff, the team had a project direction in mind. Through discovery, I surfaced alternatives and tradeoffs to present to the team, then facilitated alignment.
Speed to Deliver vs Completeness/Scalability
Strategic Planning: Upstream planning process focused on market trends, and company strategy.
Tactical Planning: Further downstream, disaggregating company strategy into a retail level plan.
Both: Ensuring the tool can support and connect these two processes.
Role Scope
Analytics Team: A more advanced reporting tool that can help the analytics team uncover insights for the business teams.
Business Team: A more generalized tool that supports the business functions directly (Marketing, Sales, and Finance).
Decision
I pushed the team to expand the scope to include strategic planning rather than going deep only on tactical planning. The bigger gap was not within any single reporting task. It was the disconnect between strategy and execution. So instead of overbuilding one part of the workflow, we chose to prototype the end-to-end decision process.
We also decided to support all core commercial roles, not just analytics.
The problem existed in the business process, not just the reporting. The analytics team owned the data interpretation because the broader process lacked a consistent, data-driven methodology. Targeting analytics as the main users would have preserved this dependency rather than solving it.
Revenue Growth Management was not owned by any single role. It was a cross-functional sensemaking process that drove commercial planning. A tool that only served the analytics team would have been antithetical to the underlying philosophy of RGM. As a result, the MVP needed to express a different operating model by supporting Marketing, Customer Development, and Finance.
Design
Methods:
Design Workshop: I opted for a design workshop because of the cross-functional nature of the problem. Orchestrating interaction across 5 different functions required tacit organizational knowledge to be embedded in the ideation phase. The workshop included workflow and interface exploration, group review, and prioritization.
Usability Testing: (n=24 users, 6 iterations) I opted for task based usability testing with think aloud. The task parameters were adapted to each role. We focused on the handoff between roles as well as the ability to answer key business questions with the dashboard. The findings were analyzed and prioritized by effort and impact.
Objectives
We needed to provide visibility to all markets and product segments so that teams could identify growth drivers and declining categories. This serves the entry point for diagnostics.
We also wanted to provide actionable insights that helped people figure out what they should do with their plan, rather than leading to analysis paralysis.
Teams needed to be able experiment with different planning approaches and project financial impact so that they could identify the best path forward.
Challenges
Growth drivers and declining categories are tracked across several dimensions, and sometimes exist at the intersection of multiple dimensions. We created linked charts that cross-filtered across dimensions, so teams could drill down from topline performance to specific markets, product segments, or categories while preserving the broader context they started from.
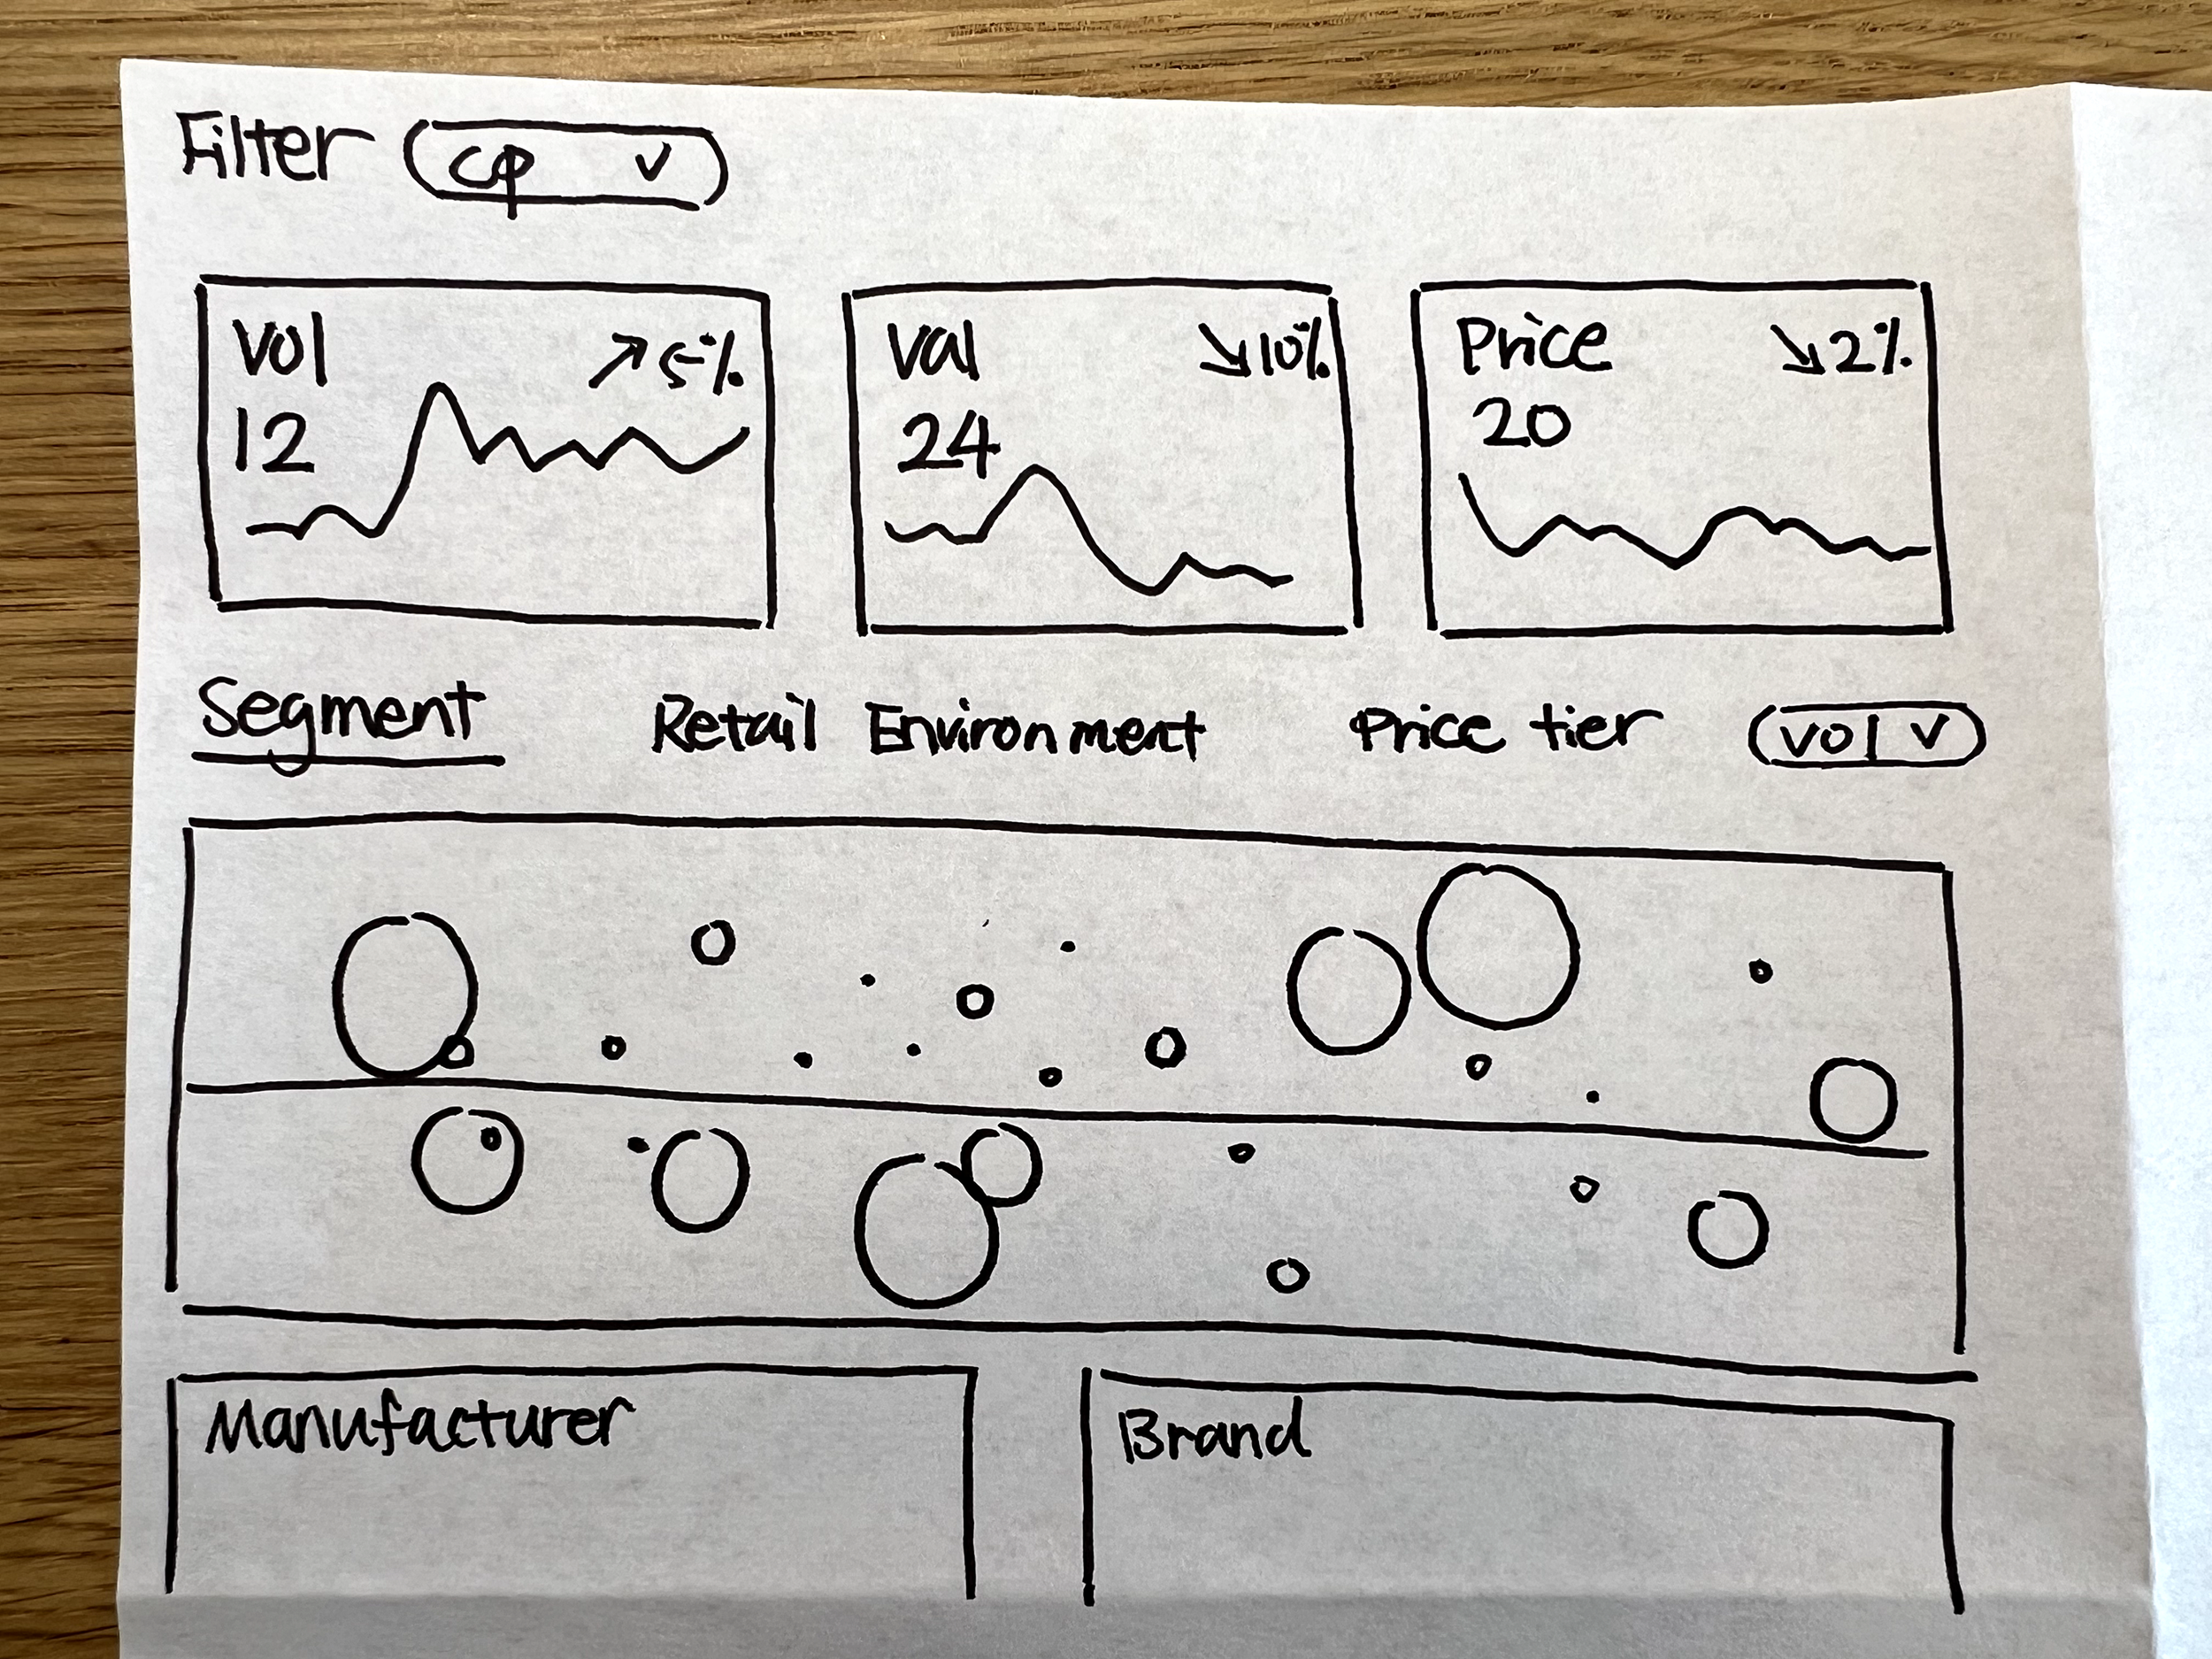
Trying to find the best way to abstract the matrixed dimensions.
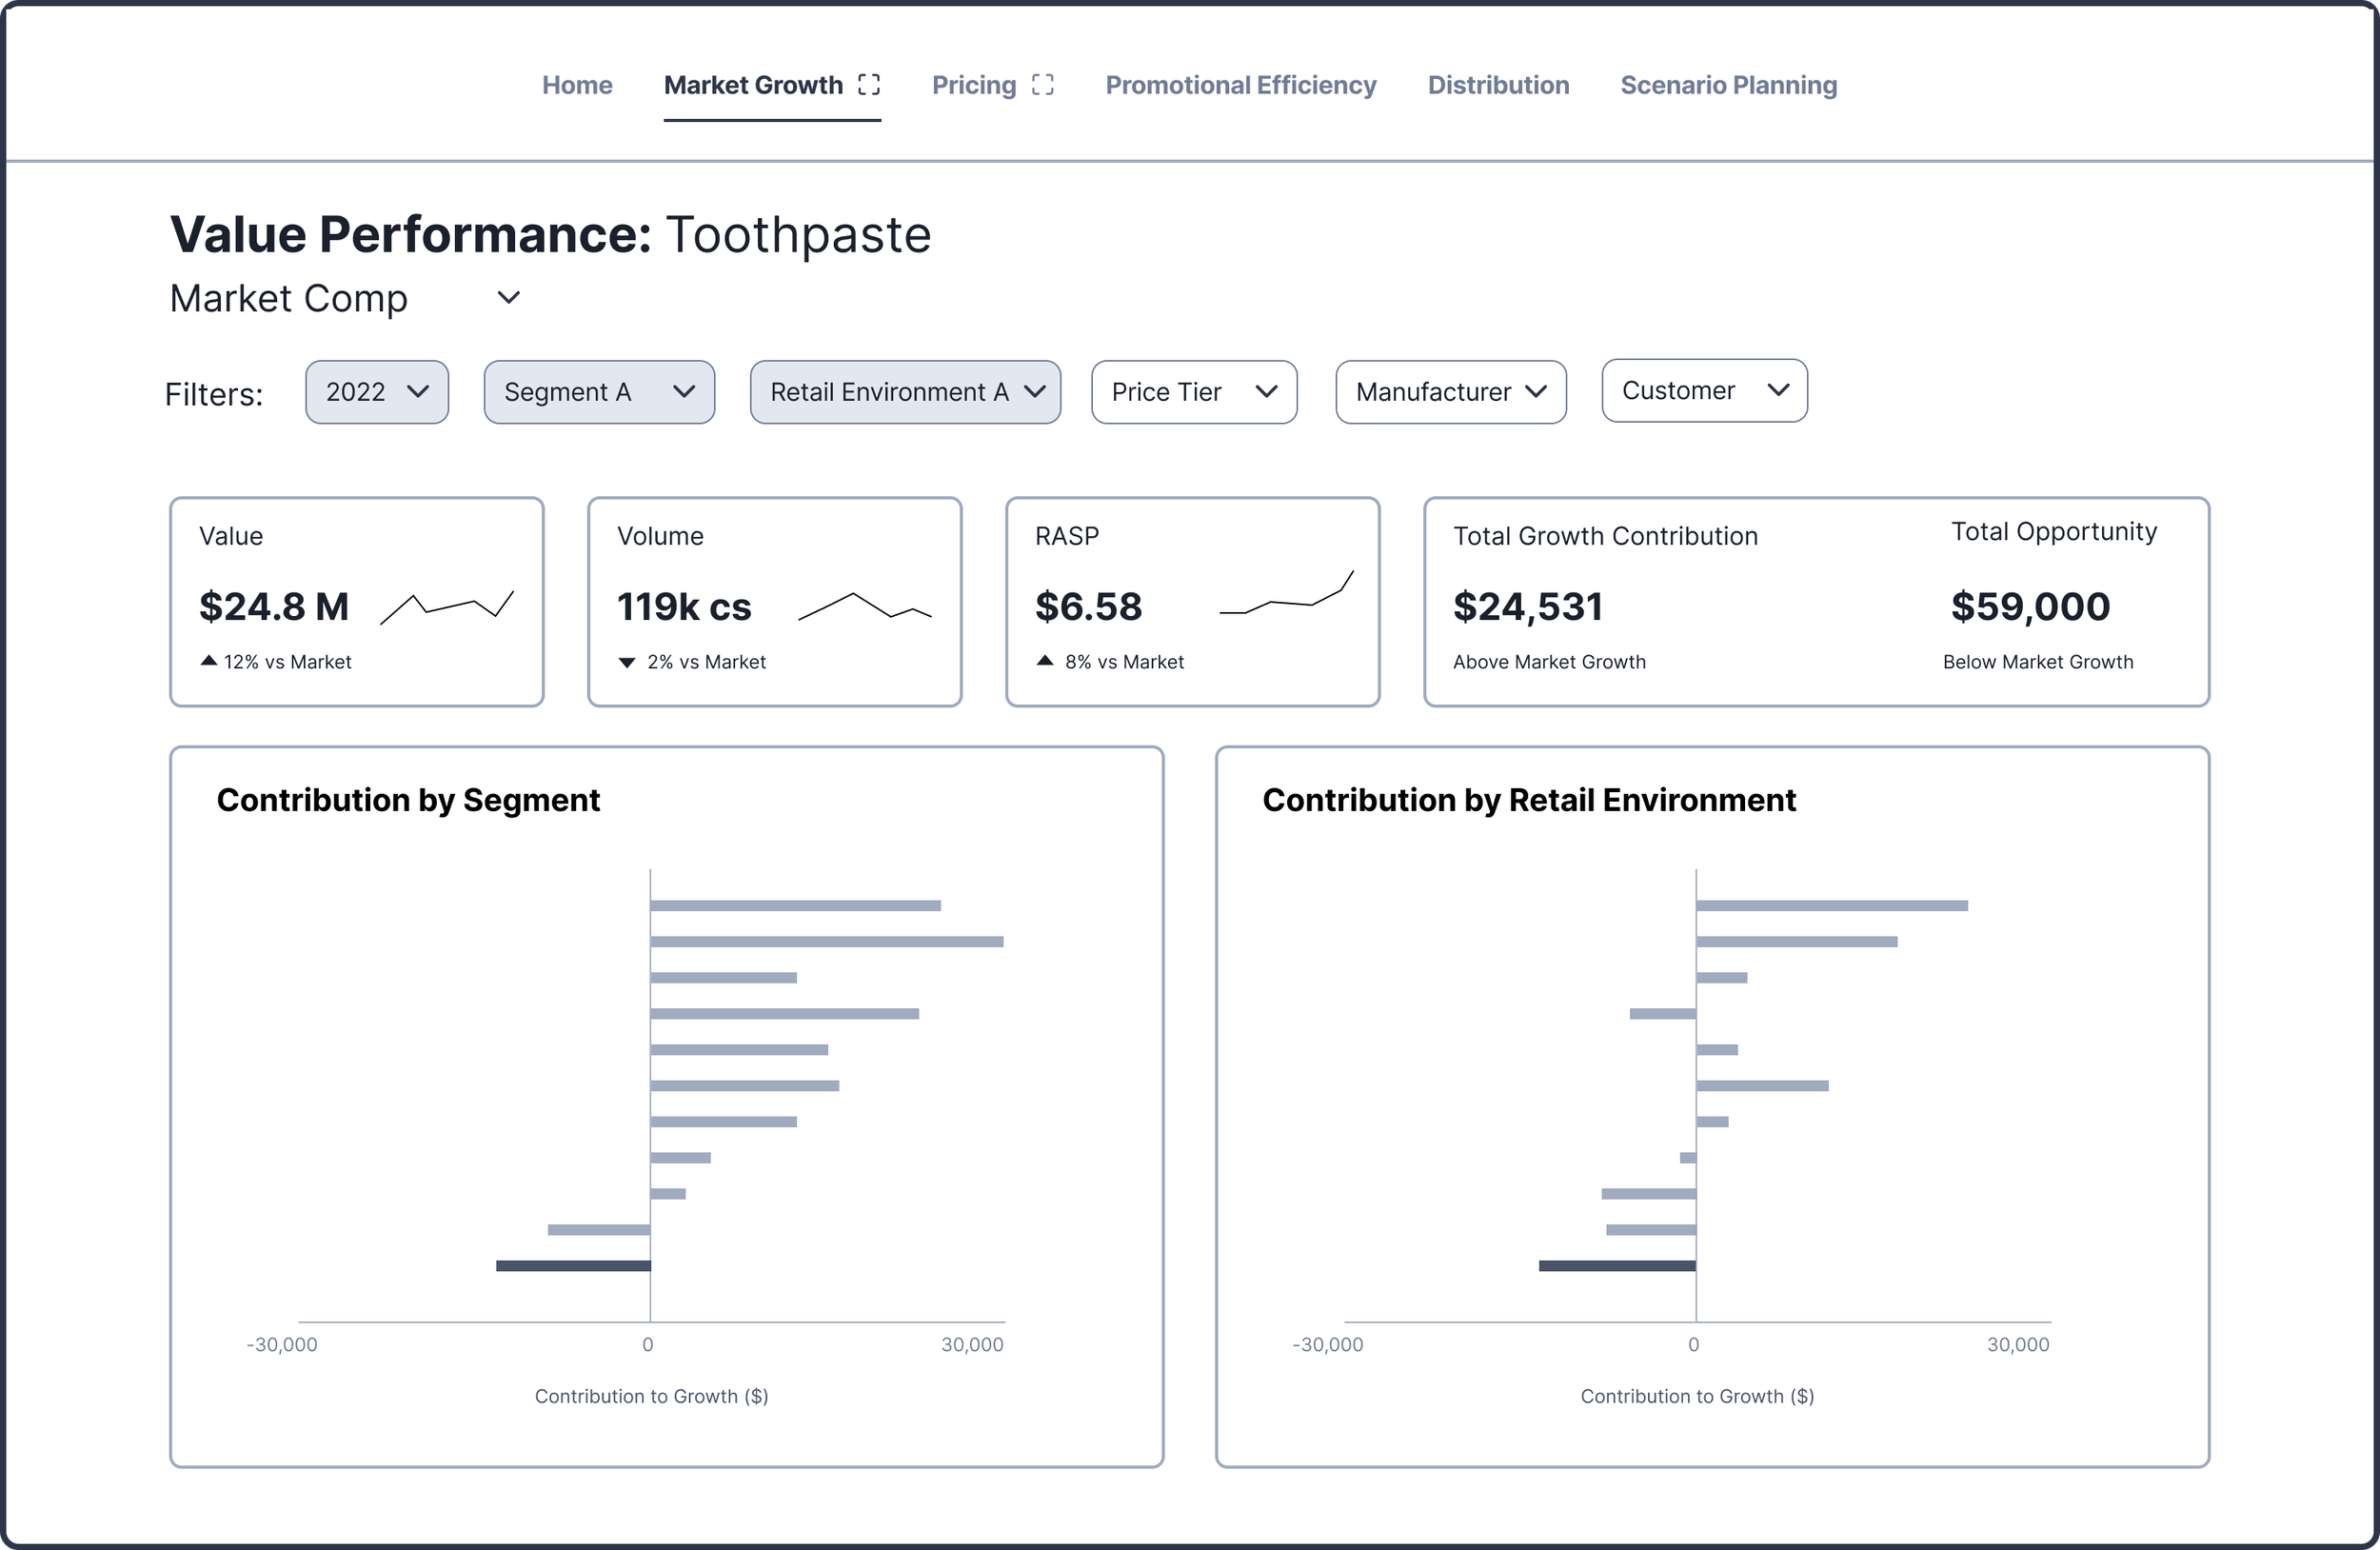
This direction is where we saw improvements in testing.
Helping teams get comfortable stepping outside their usual strategies required giving them the freedom to break habits. An iterative scenario builder let teams construct and compare approaches side by side, lowering the perceived risk of trying something new.
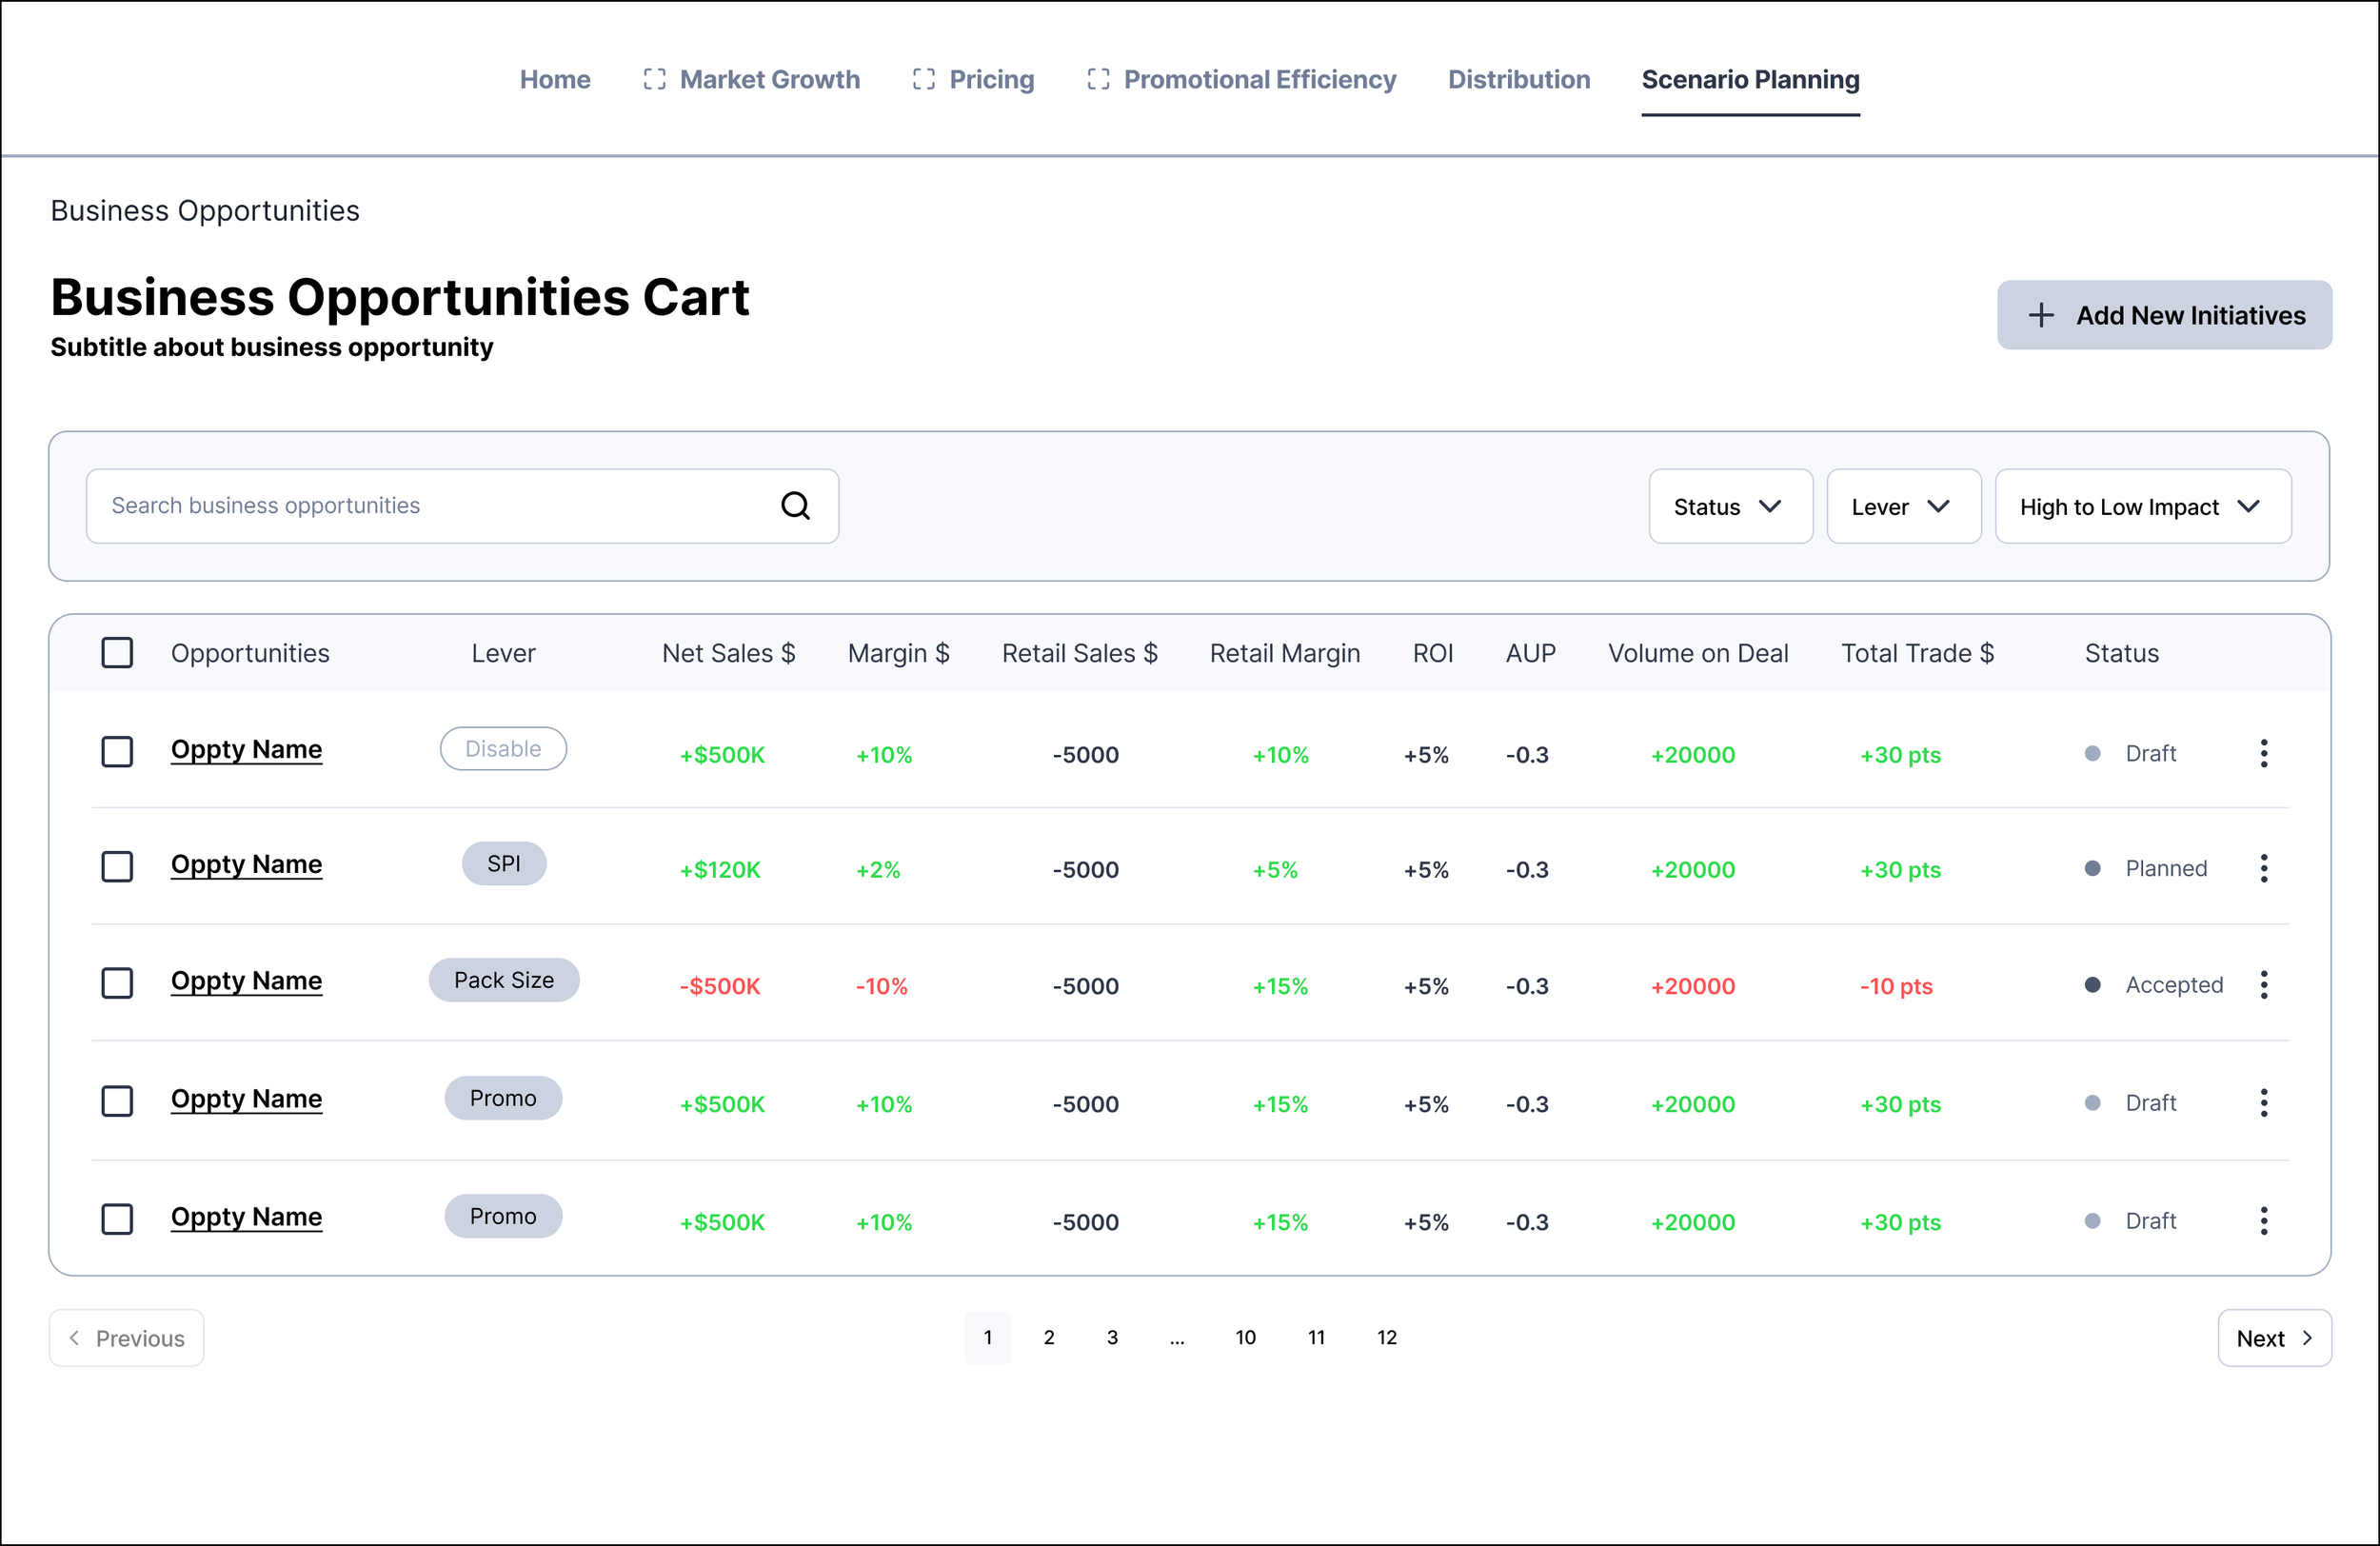
Aggregated view of scenarios
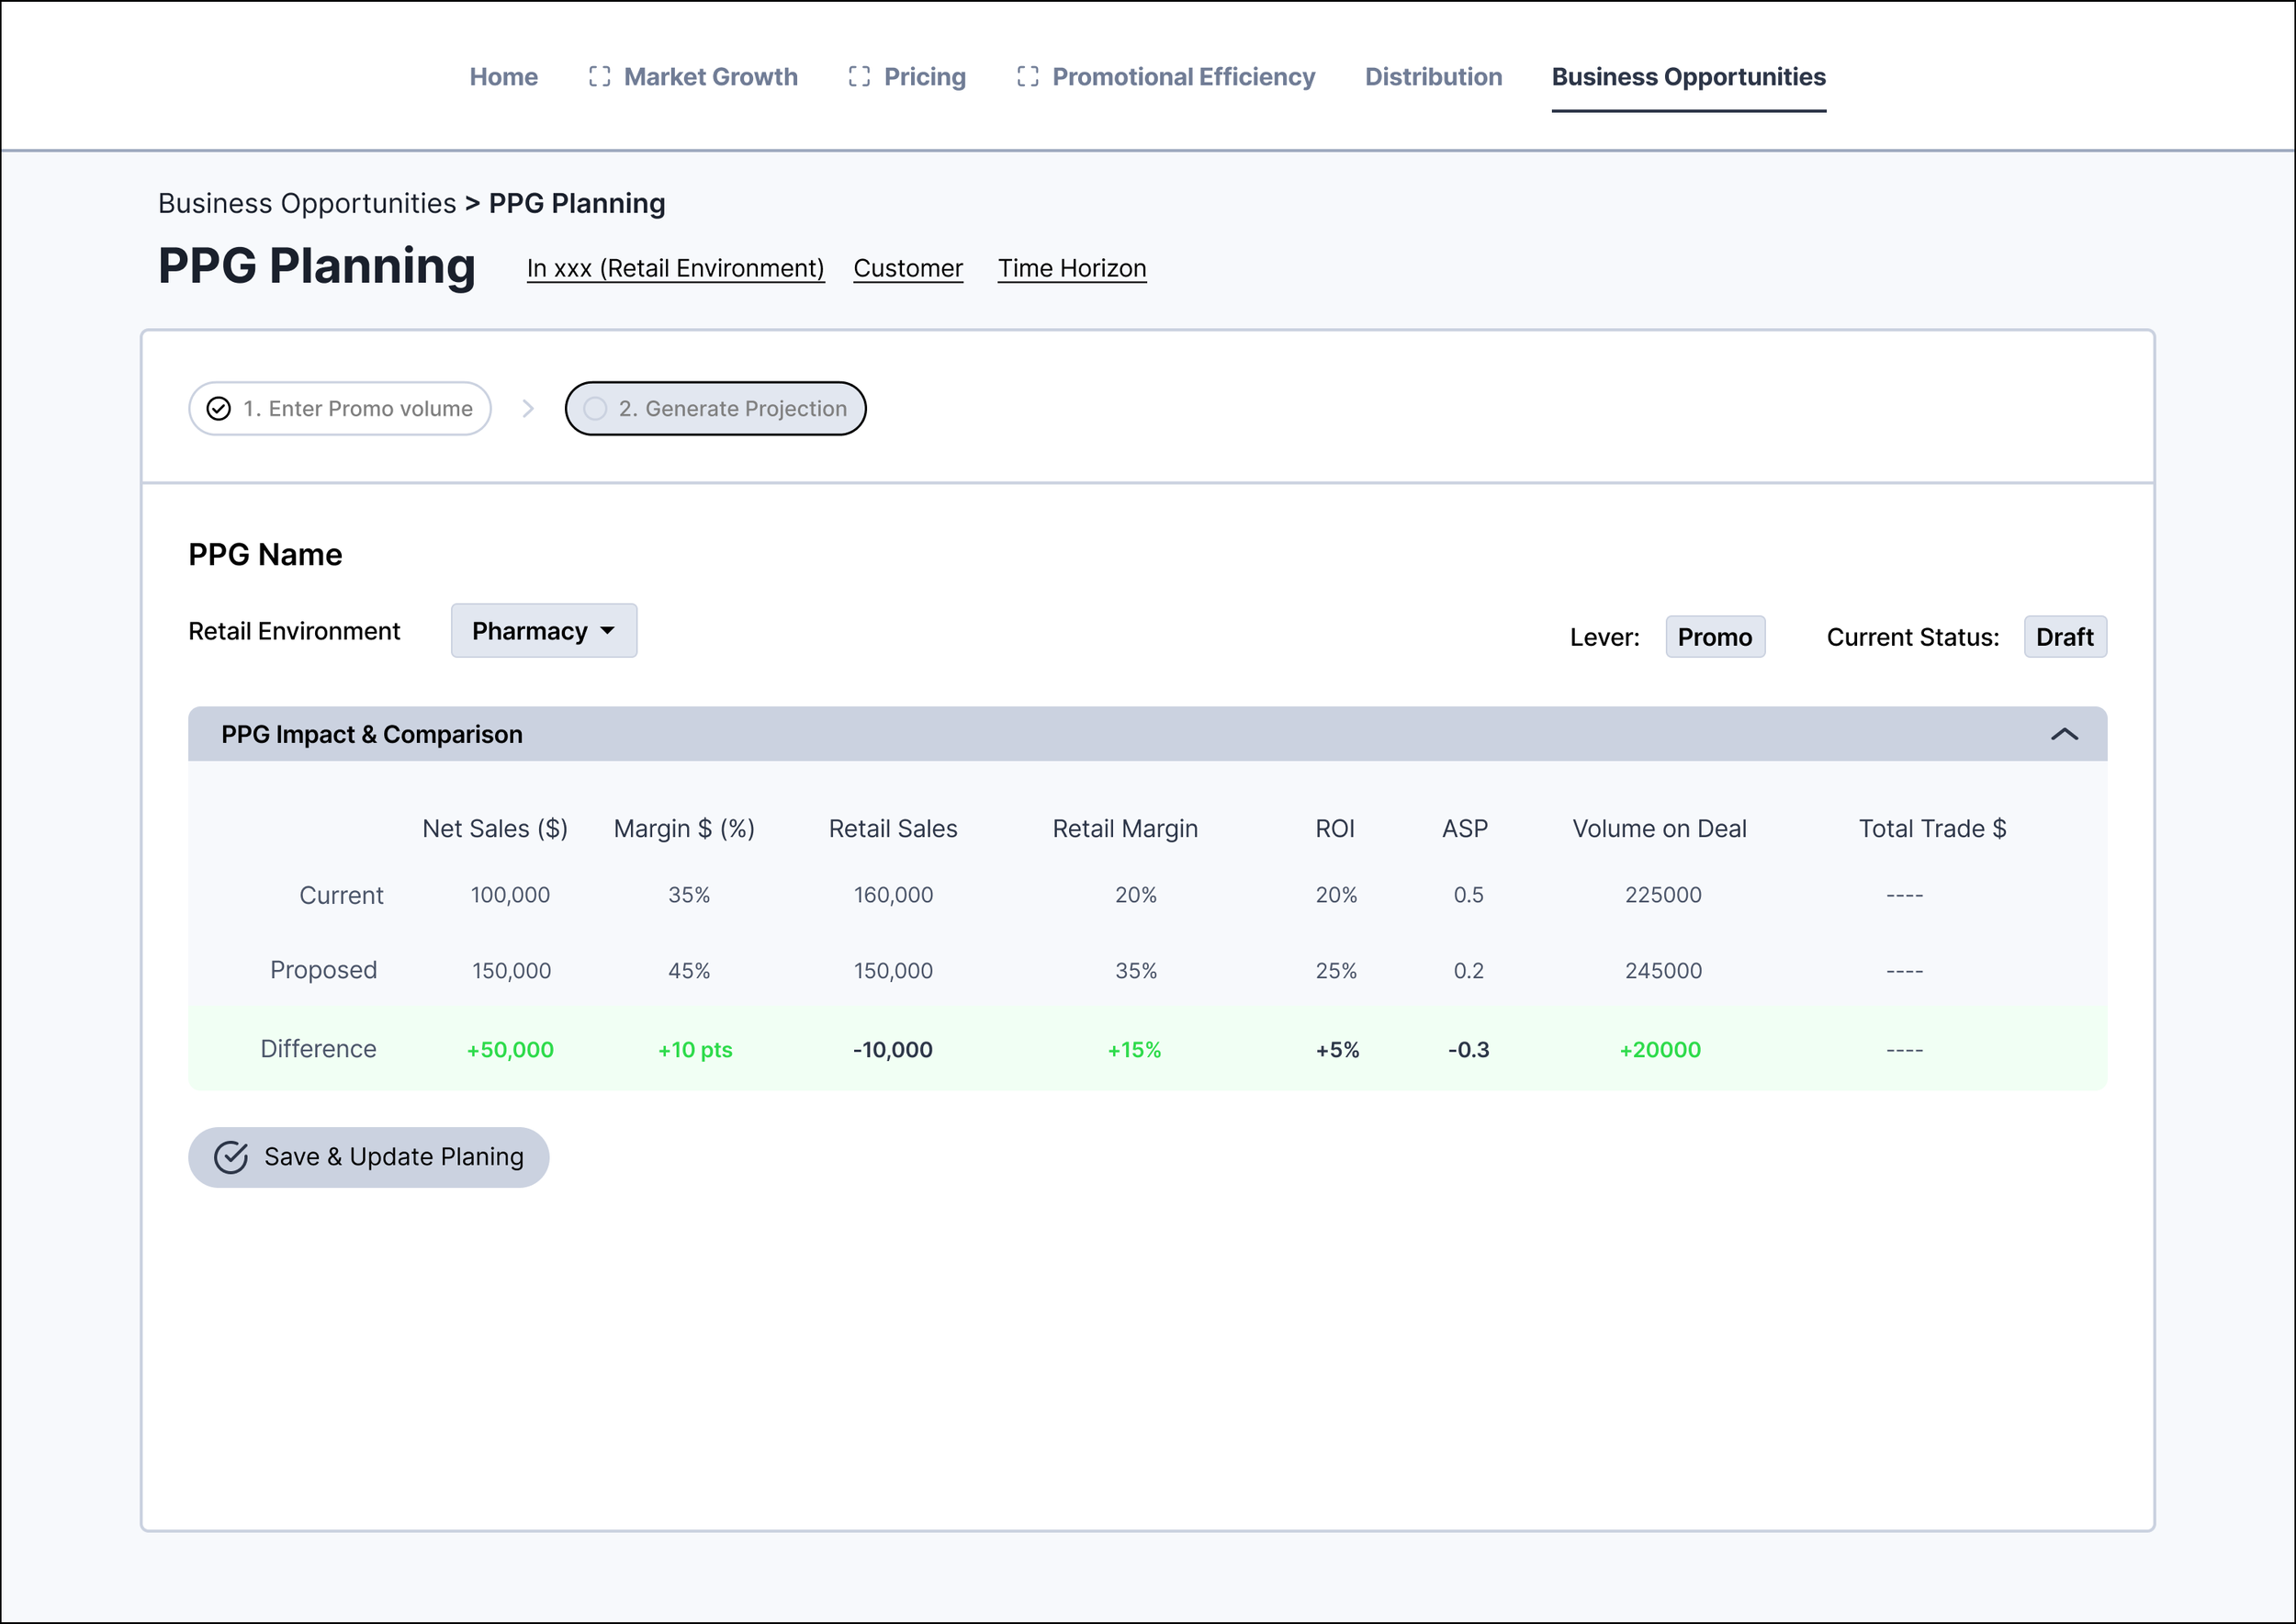
Review impact of scenario and commit
High Fidelity
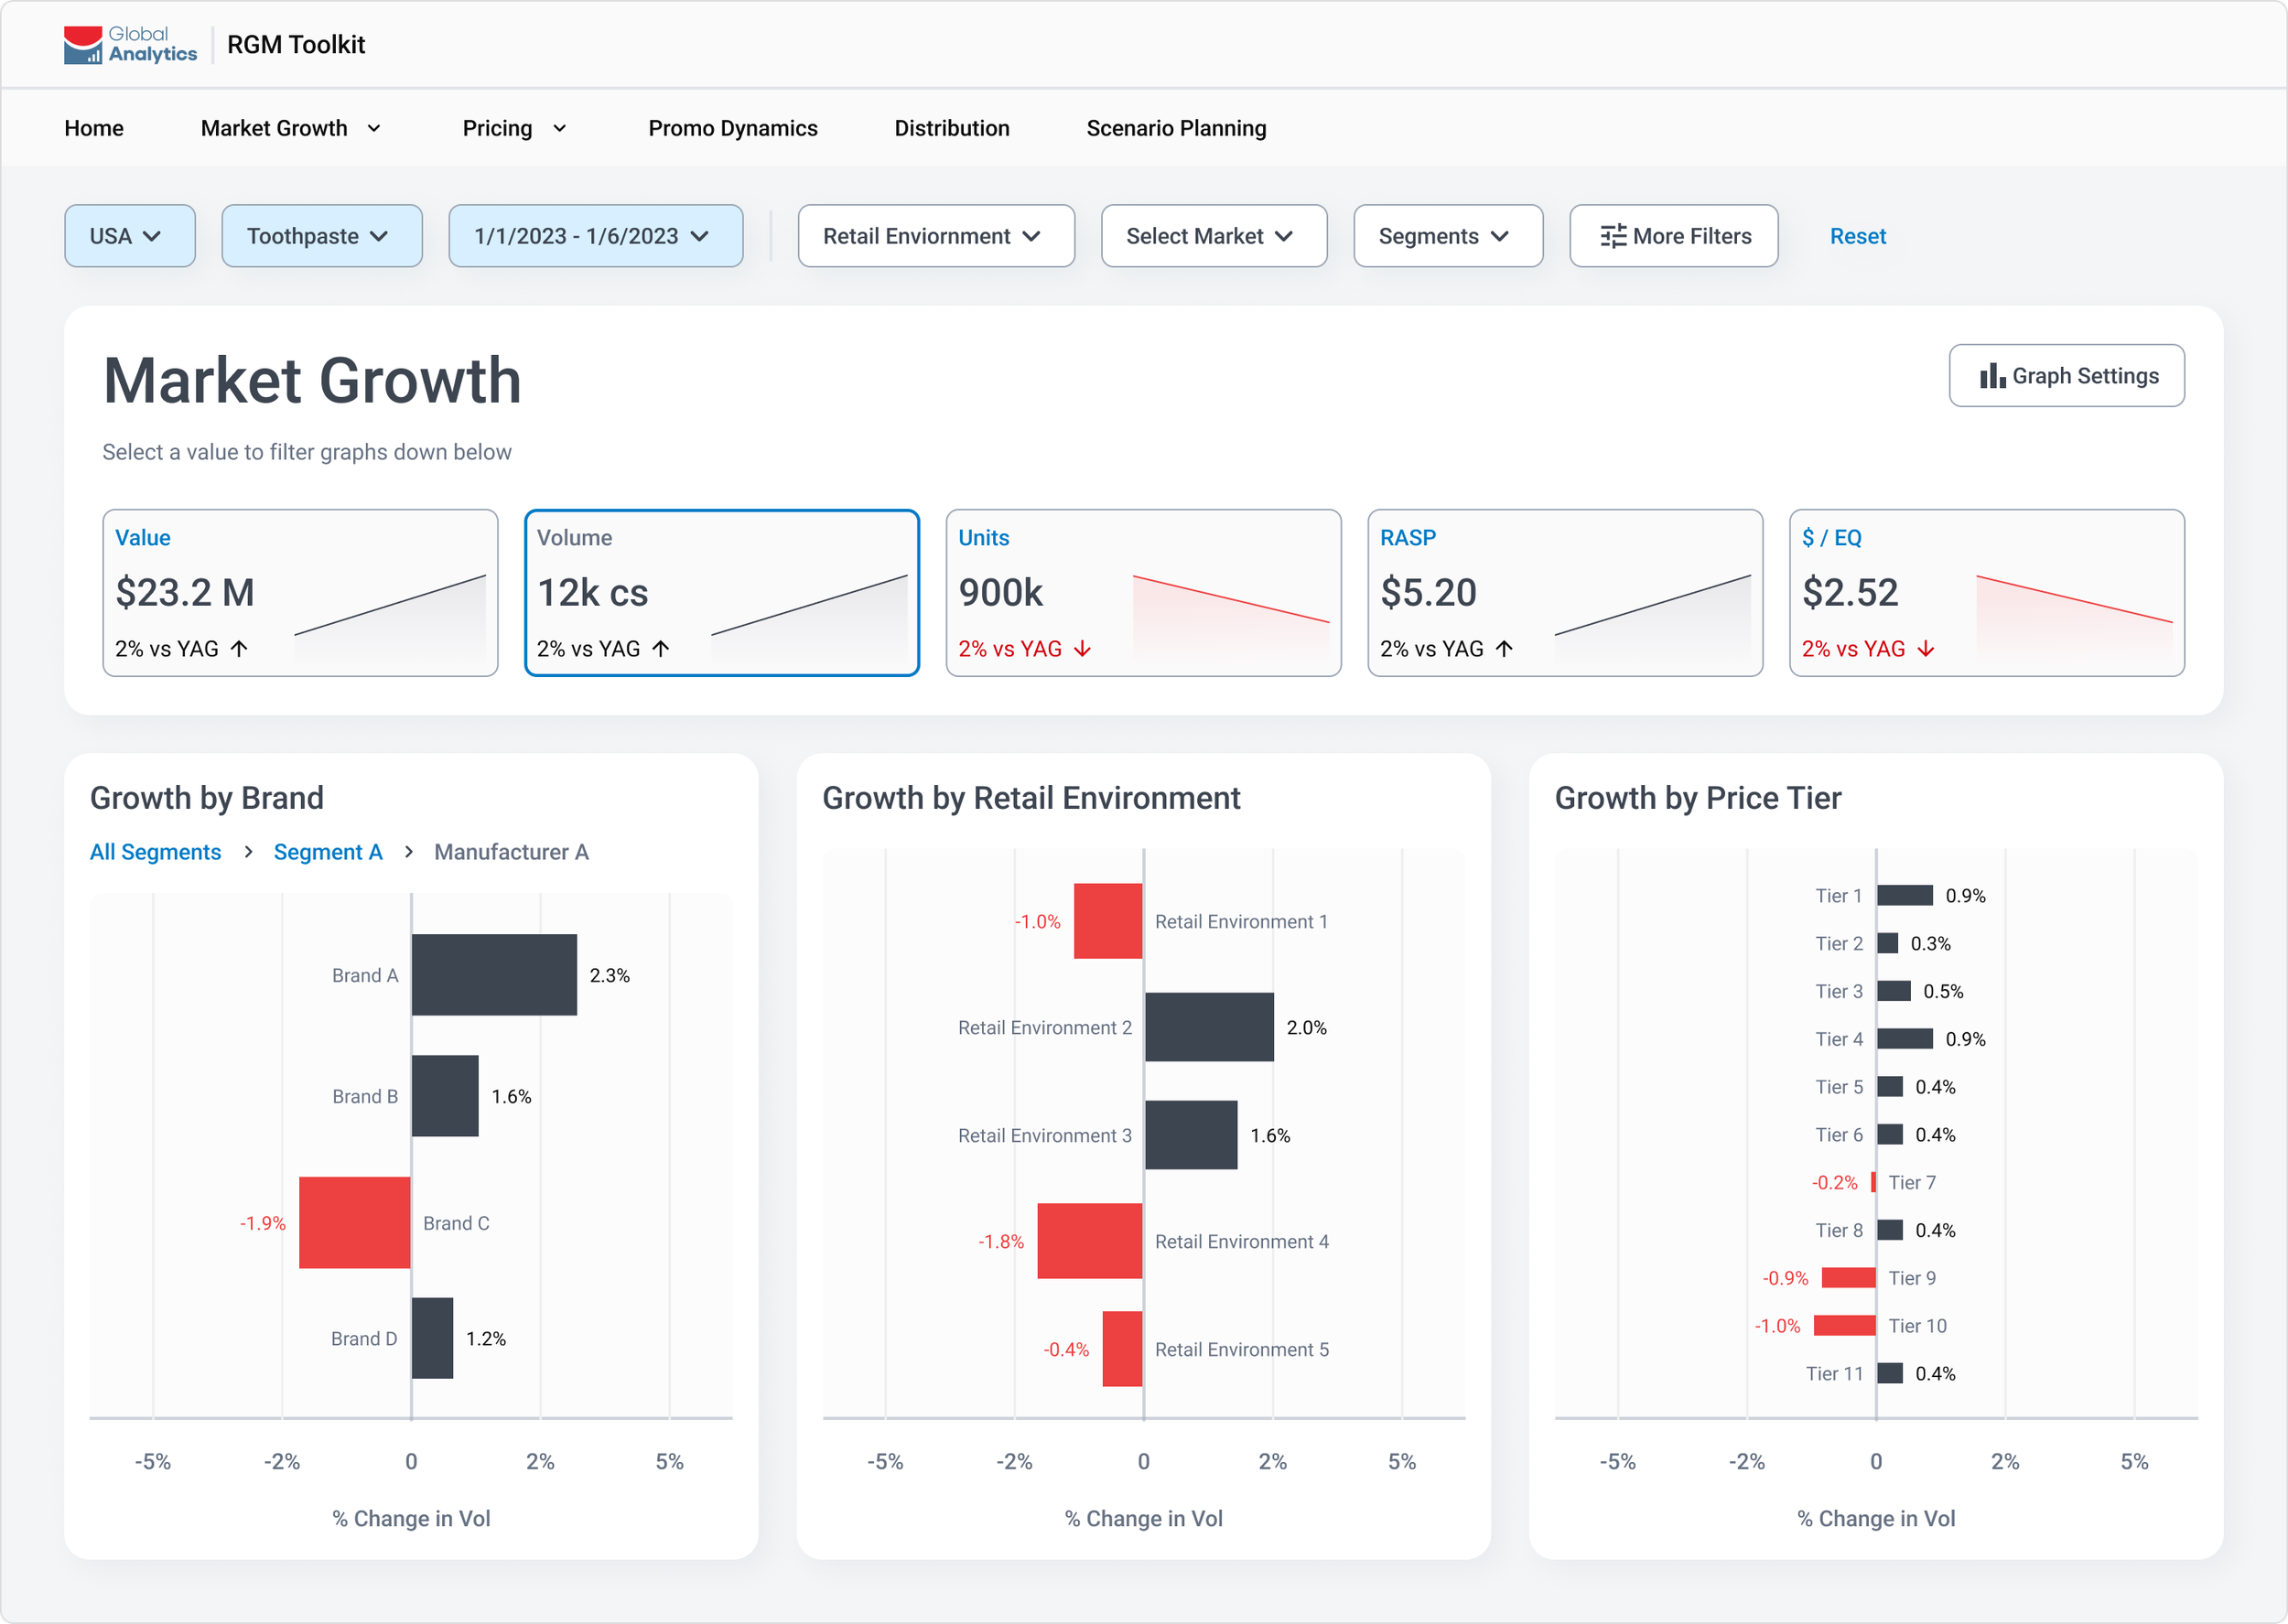
Start from topline view, drill down to find key drivers to start analysis
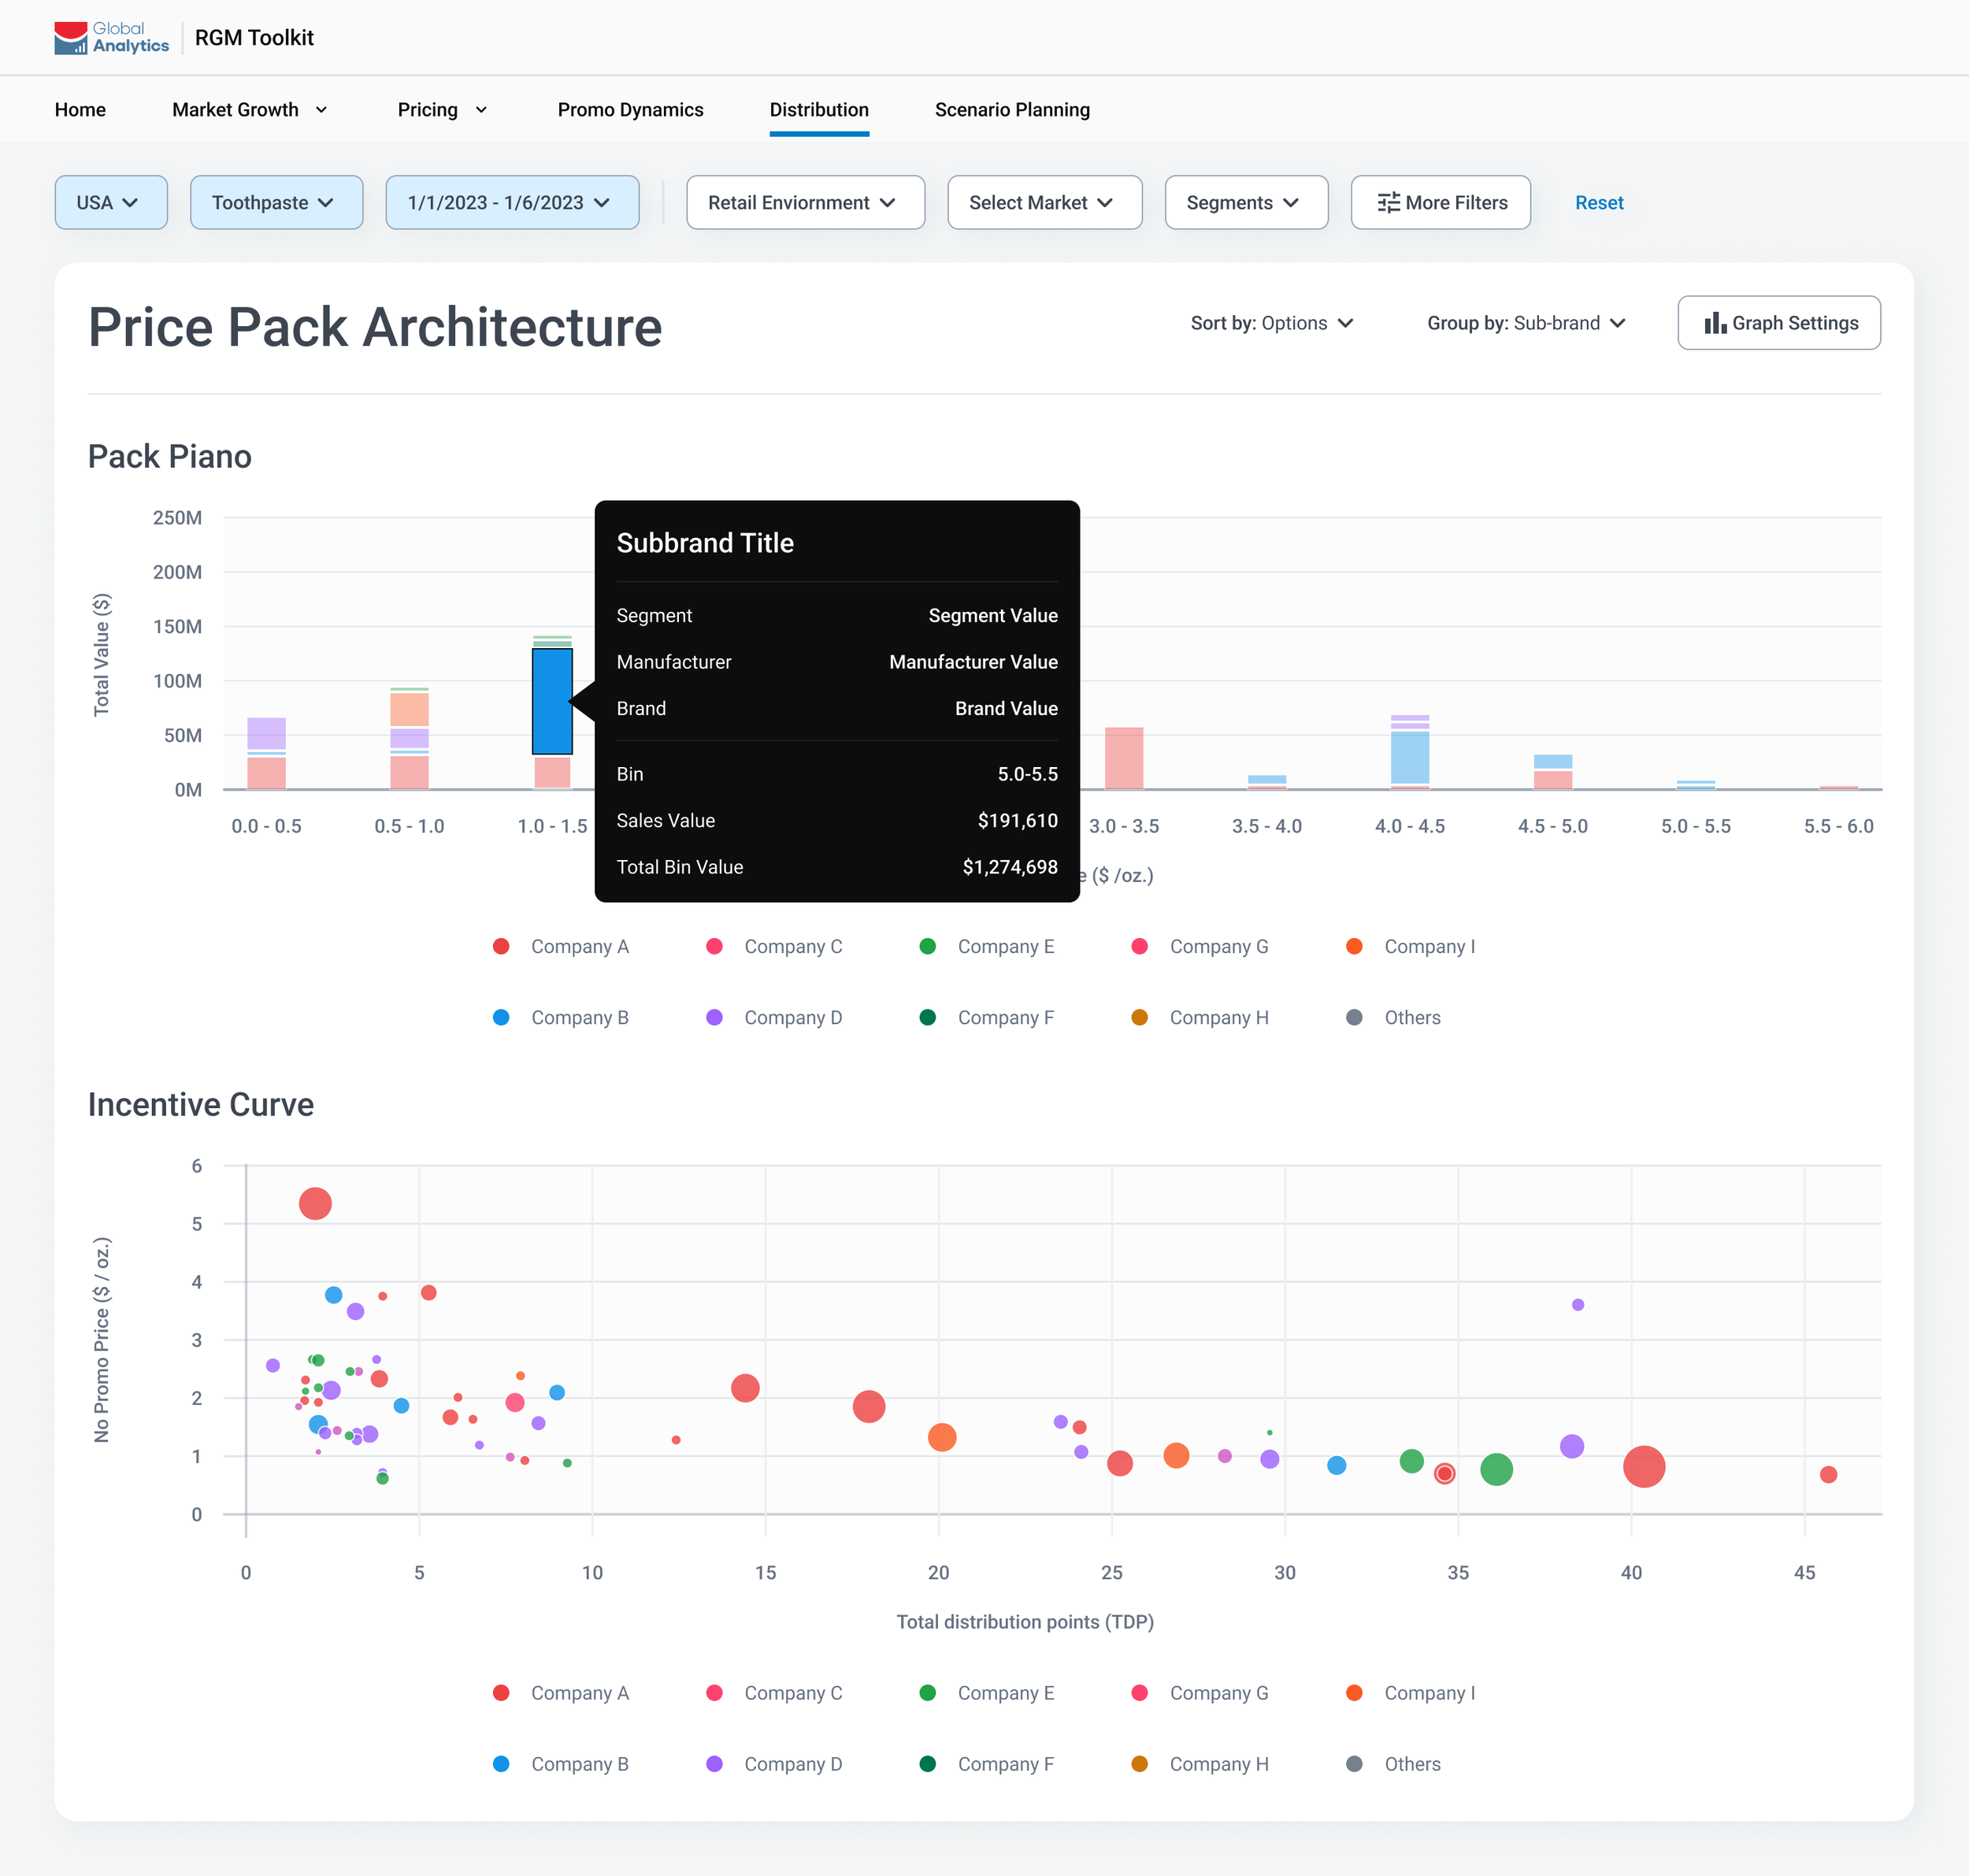
Perform diagnostics based on the key drivers
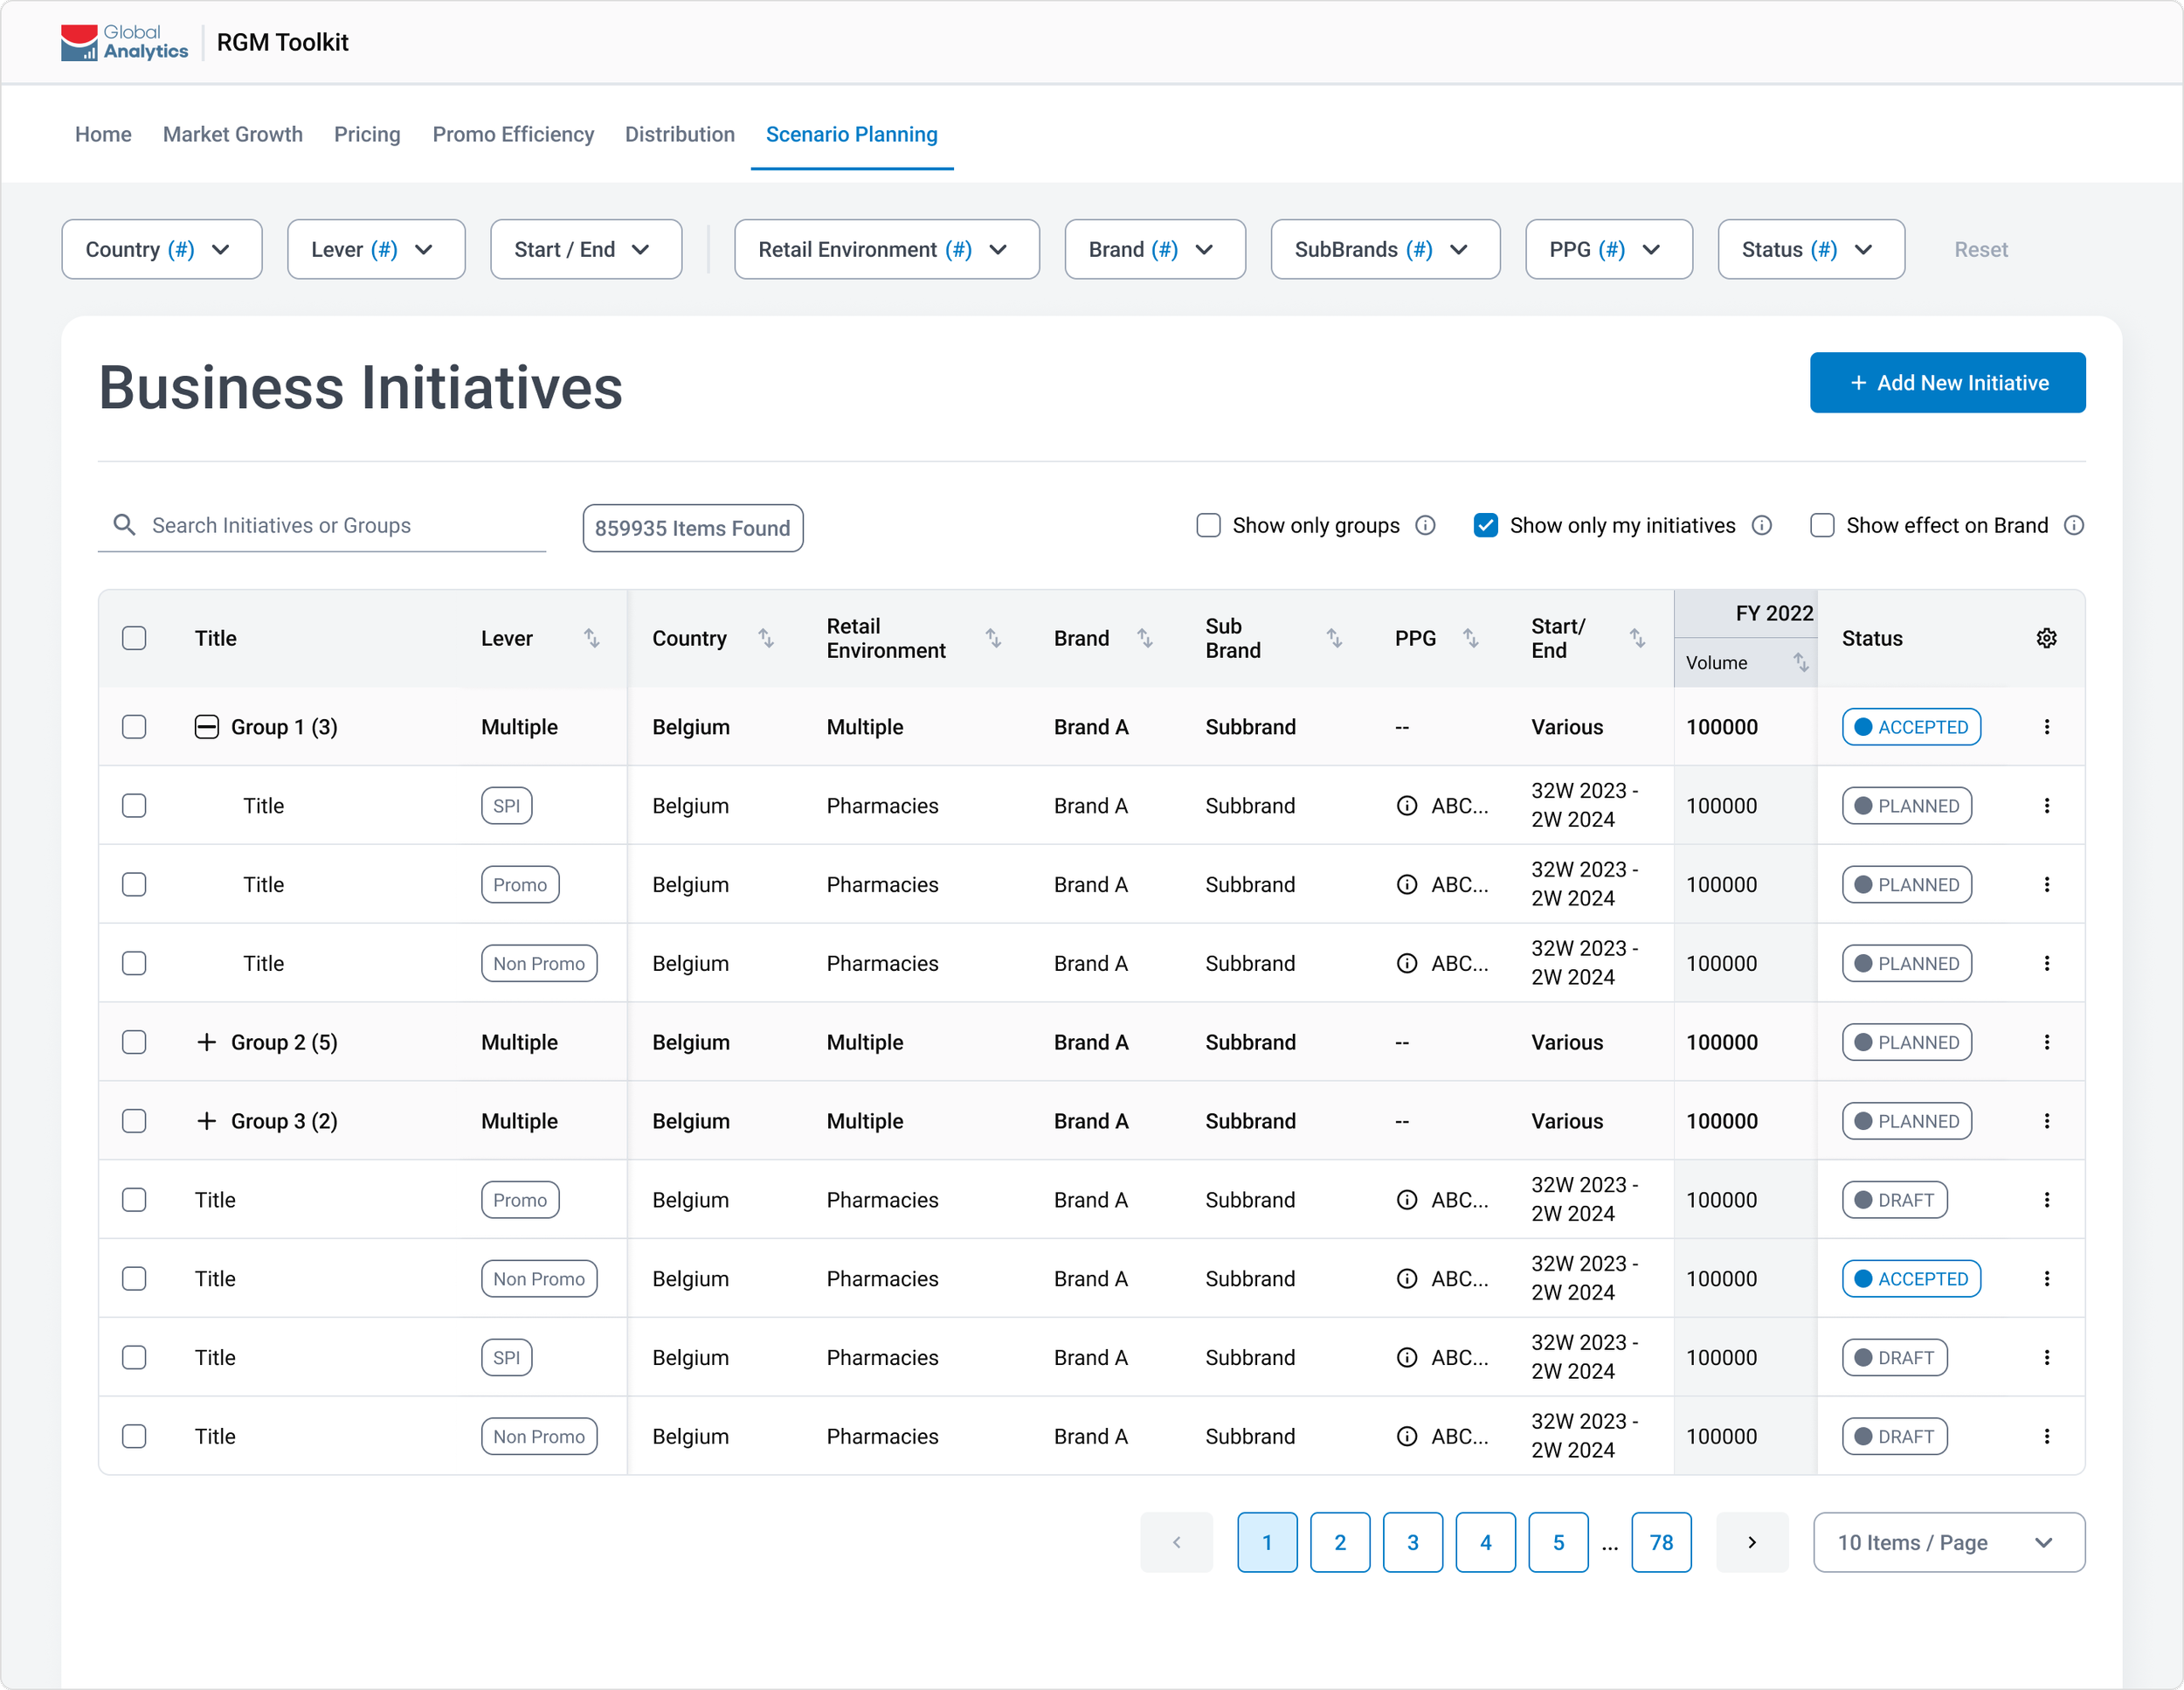
Topline view of user’s aggregated scenarios. Create new scenario from here
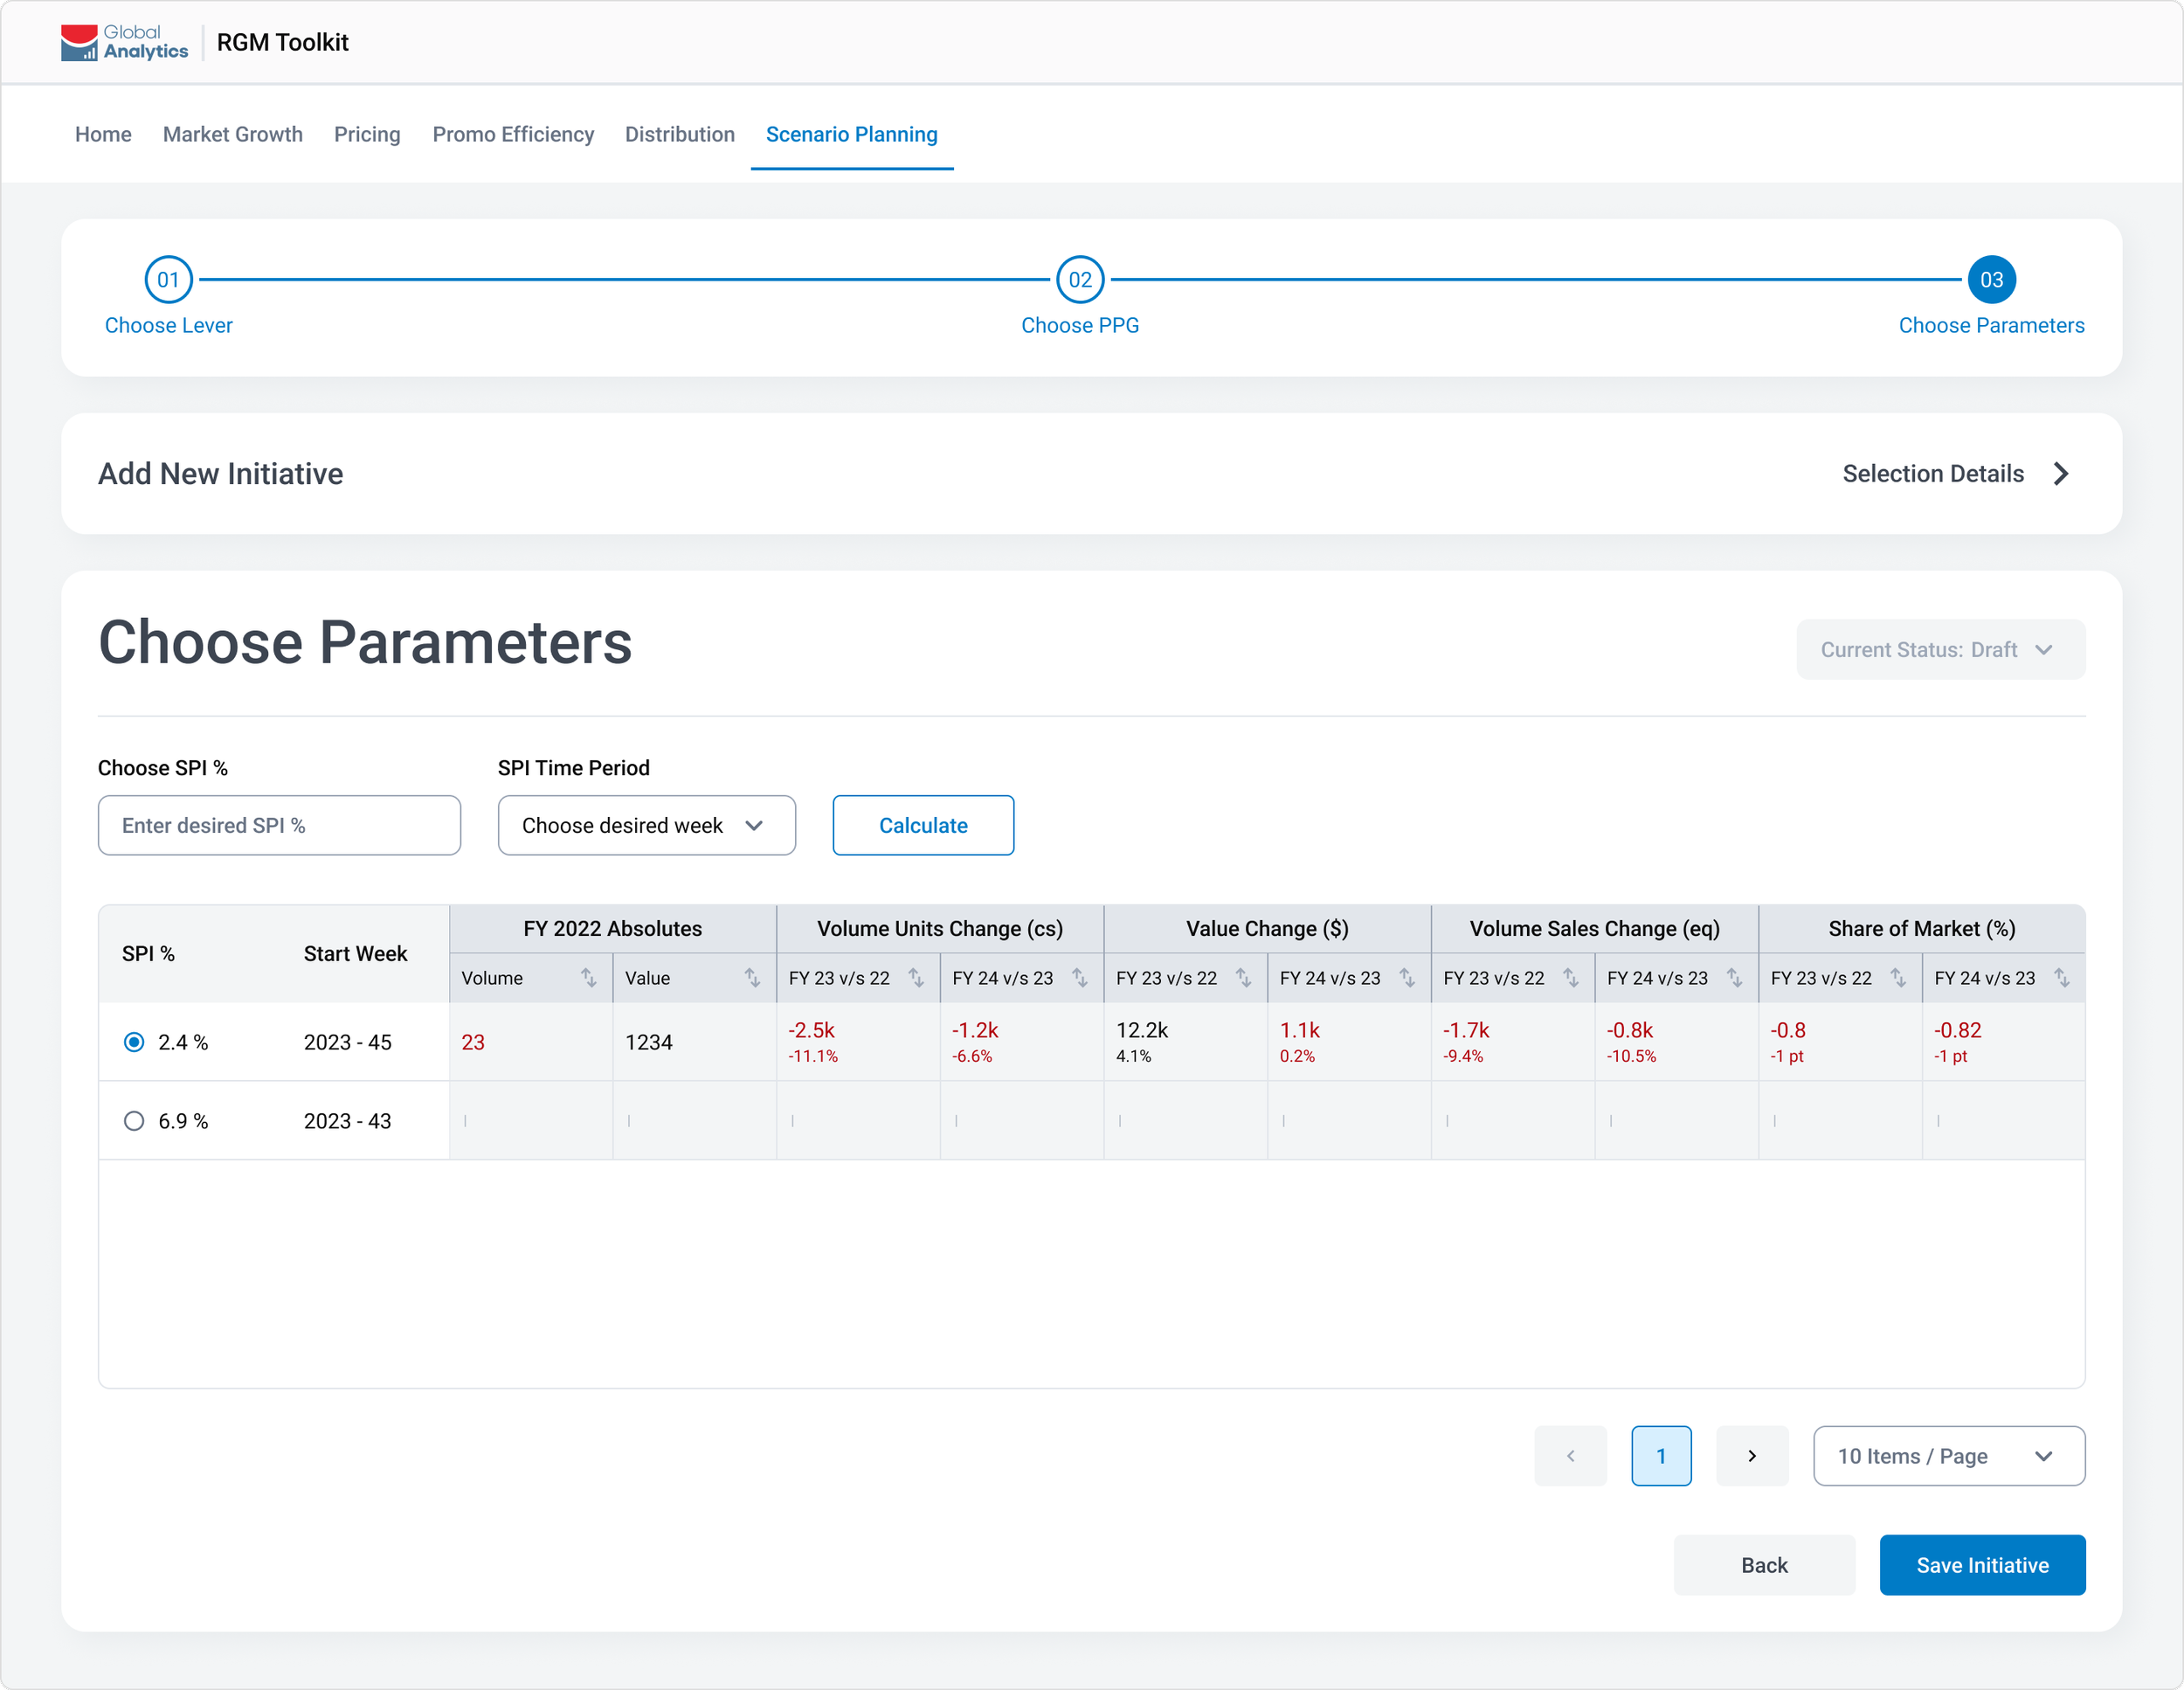
Review impact of scenario before committing.
Impact
Metric collection is in progress and will be updated soon.